
Operators cannot tell which Cisco platform hop failed for a given city-portal request because the app only emits local print statements. What observability design set should the integration hop expose?
Select an answer to reveal the explanation.
Short Explanation
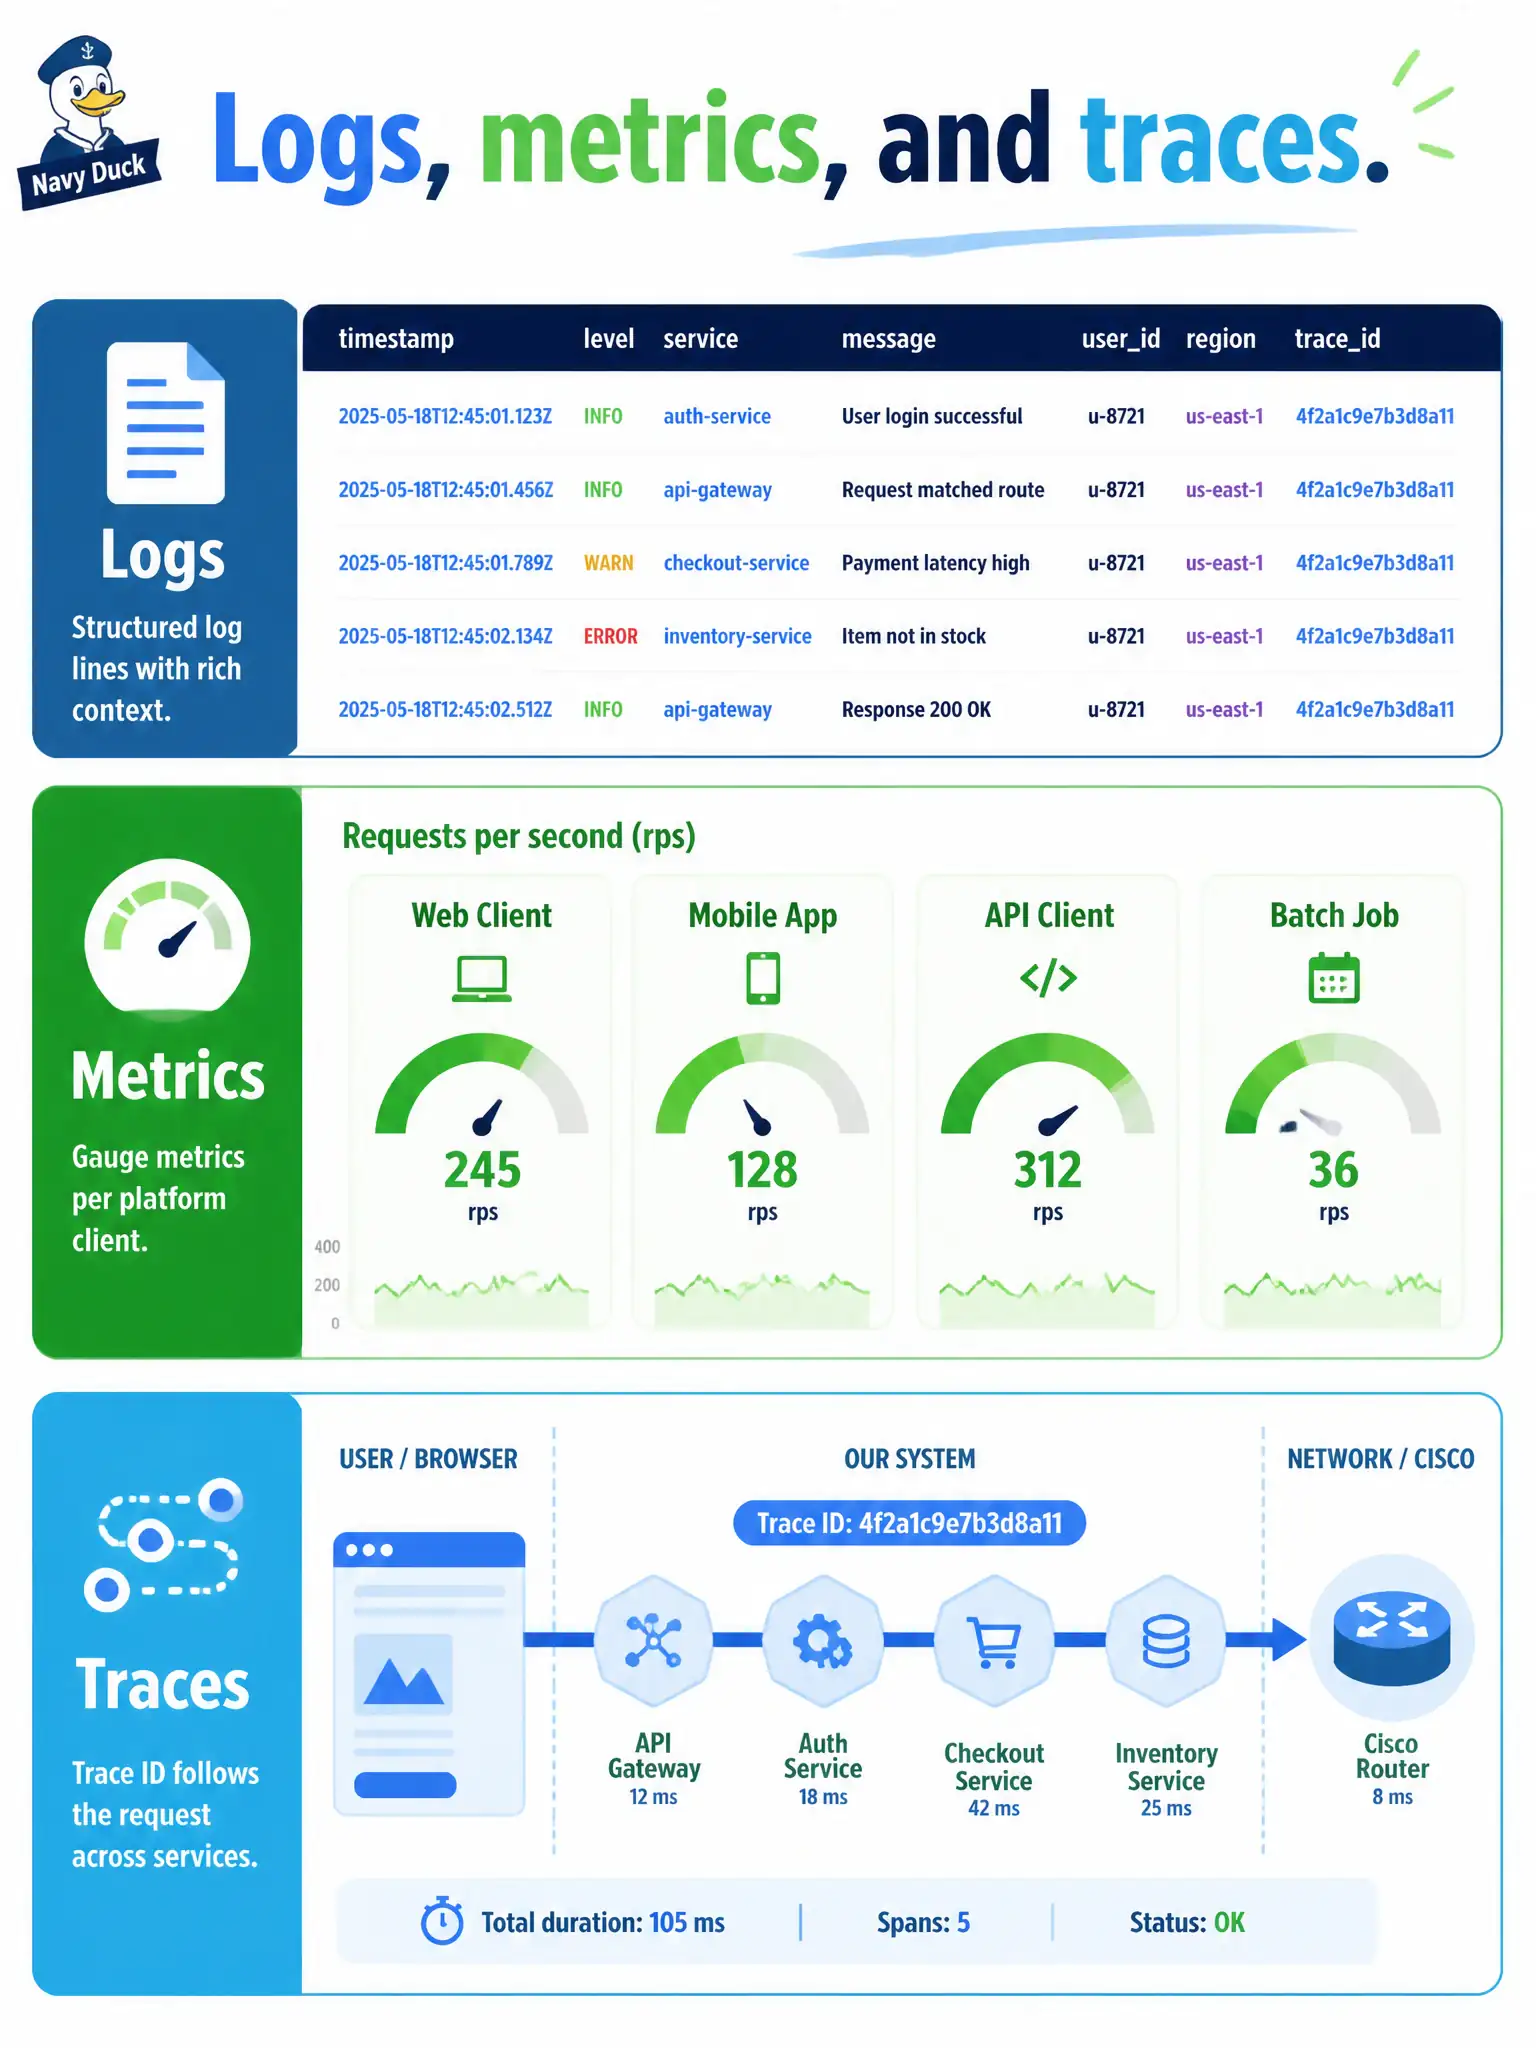
Print statements are sticky notes on one desk—they cannot answer which hop failed for this request. Observability means structured logs, per-client latency and error metrics, and a trace ID that follows the call. “We have logging” alone is not enough.
Full Explanation
Operators cannot triage which Cisco platform hop failed for a city-portal request from local print statements alone. Observability for an integration hop means structured logs, a latency and error metric per platform client, and a trace identifier that follows the call across workers and facades. Together those signals answer which hop failed, how often, how slow, and for which request.
Denser print statements with no metrics or cross-hop correlation fail because they stay siloed, hard to query, and blind to rate and latency trends. A single global counter that increments once per day fails by erasing per-hop and per-request signal. Screenshots of the operator console on a shared drive after outages fail as reactive folklore, not continuous telemetry.
Exam caveat: logs without cardinality control can become expensive noise; structure fields deliberately (hop name, status, latency, trace ID) rather than dumping full payloads by default.
Operational check: force a Meraki timeout in staging and confirm logs and metrics attribute the error to the Meraki client, while the shared trace ID links the portal request to that hop.
Export those metrics to the municipal NOC tooling and alert on error-rate and latency SLOs per DNA Center, Meraki, or Webex client—not one opaque application-down signal. Structured logs should include hop name, HTTP status or SDK error class, duration, and trace ID. That set turns print-debugging into operable Cisco integration observability.