
What should a constructed DNA Center script print to truly “display wireless health” for operators?
Select an answer to reveal the explanation.
Short Explanation
Display means operators see the score and the why—poor/fair/good style buckets—not a raw JSON dump left in a log drawer.
Full Explanation
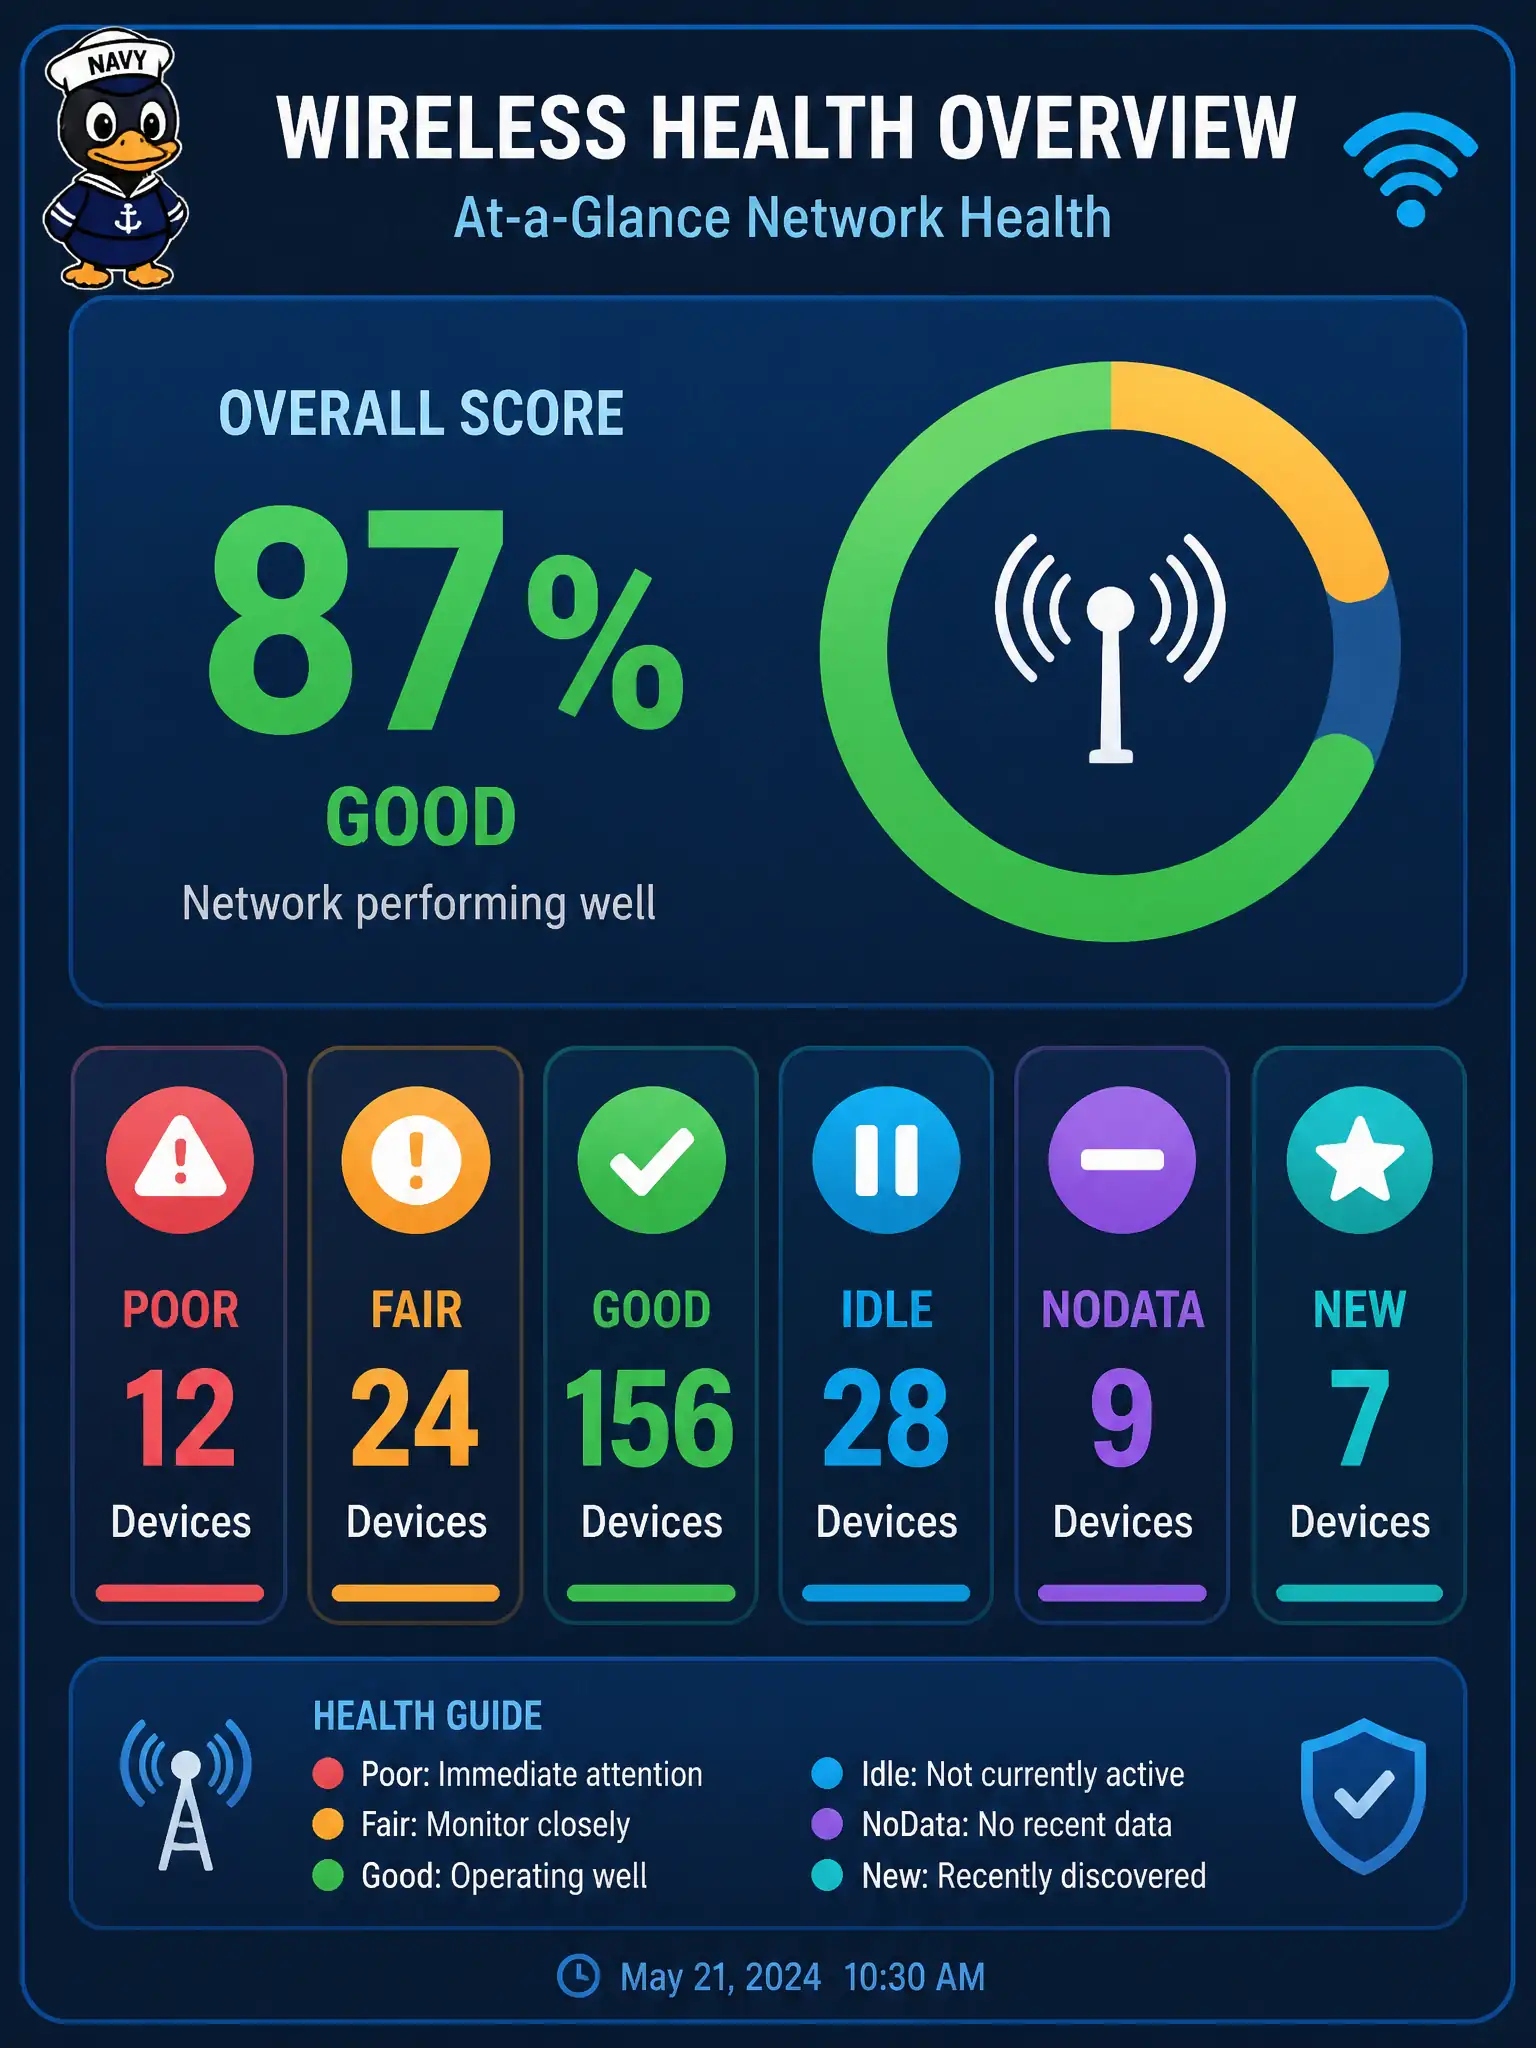
Truly displaying wireless health for operators means showing the wireless score plus child buckets such as poor, fair, good, idle, nodata, and new. Those buckets explain distribution behind a single score so NOC staff can see whether a “yellow” score is a few poor clients or a broad fair population across city sites and venues.
Logging only an unparsed JSON blob to a file fails as a display for operators who need readable wireless fields and counts, not a raw dump left for someone else to interpret later. Citing a Grafana dashboard product SKU and license tier fails by inventing a commercial packaging answer unrelated to parsing DNA Center scoreDetail. Scraping RF survey RSSI heat values from access points over SNMP fails the task’s assurance-API focus: RSSI surveys are useful elsewhere but are not the Intent client-health wireless bucket display this constructed script must produce.
Exam caveat: “display” on the exam implies the wireless category’s score and meaningful breakdown—not merely that a GET returned 200 or that JSON landed on disk without category selection.
Operational check: render scoreValue, clientCount, and each child bucket in the script output or civic dashboard panel, add a threshold check that opens a ticket when poor or fair counts spike relative to the city’s baseline, and keep a sample of printed lines in the change record for auditors.