
While reviewing APM for a grants portal Function, a developer confuses terminology. What is the difference between a trace and a span?
Select an answer to reveal the explanation.
Short Explanation
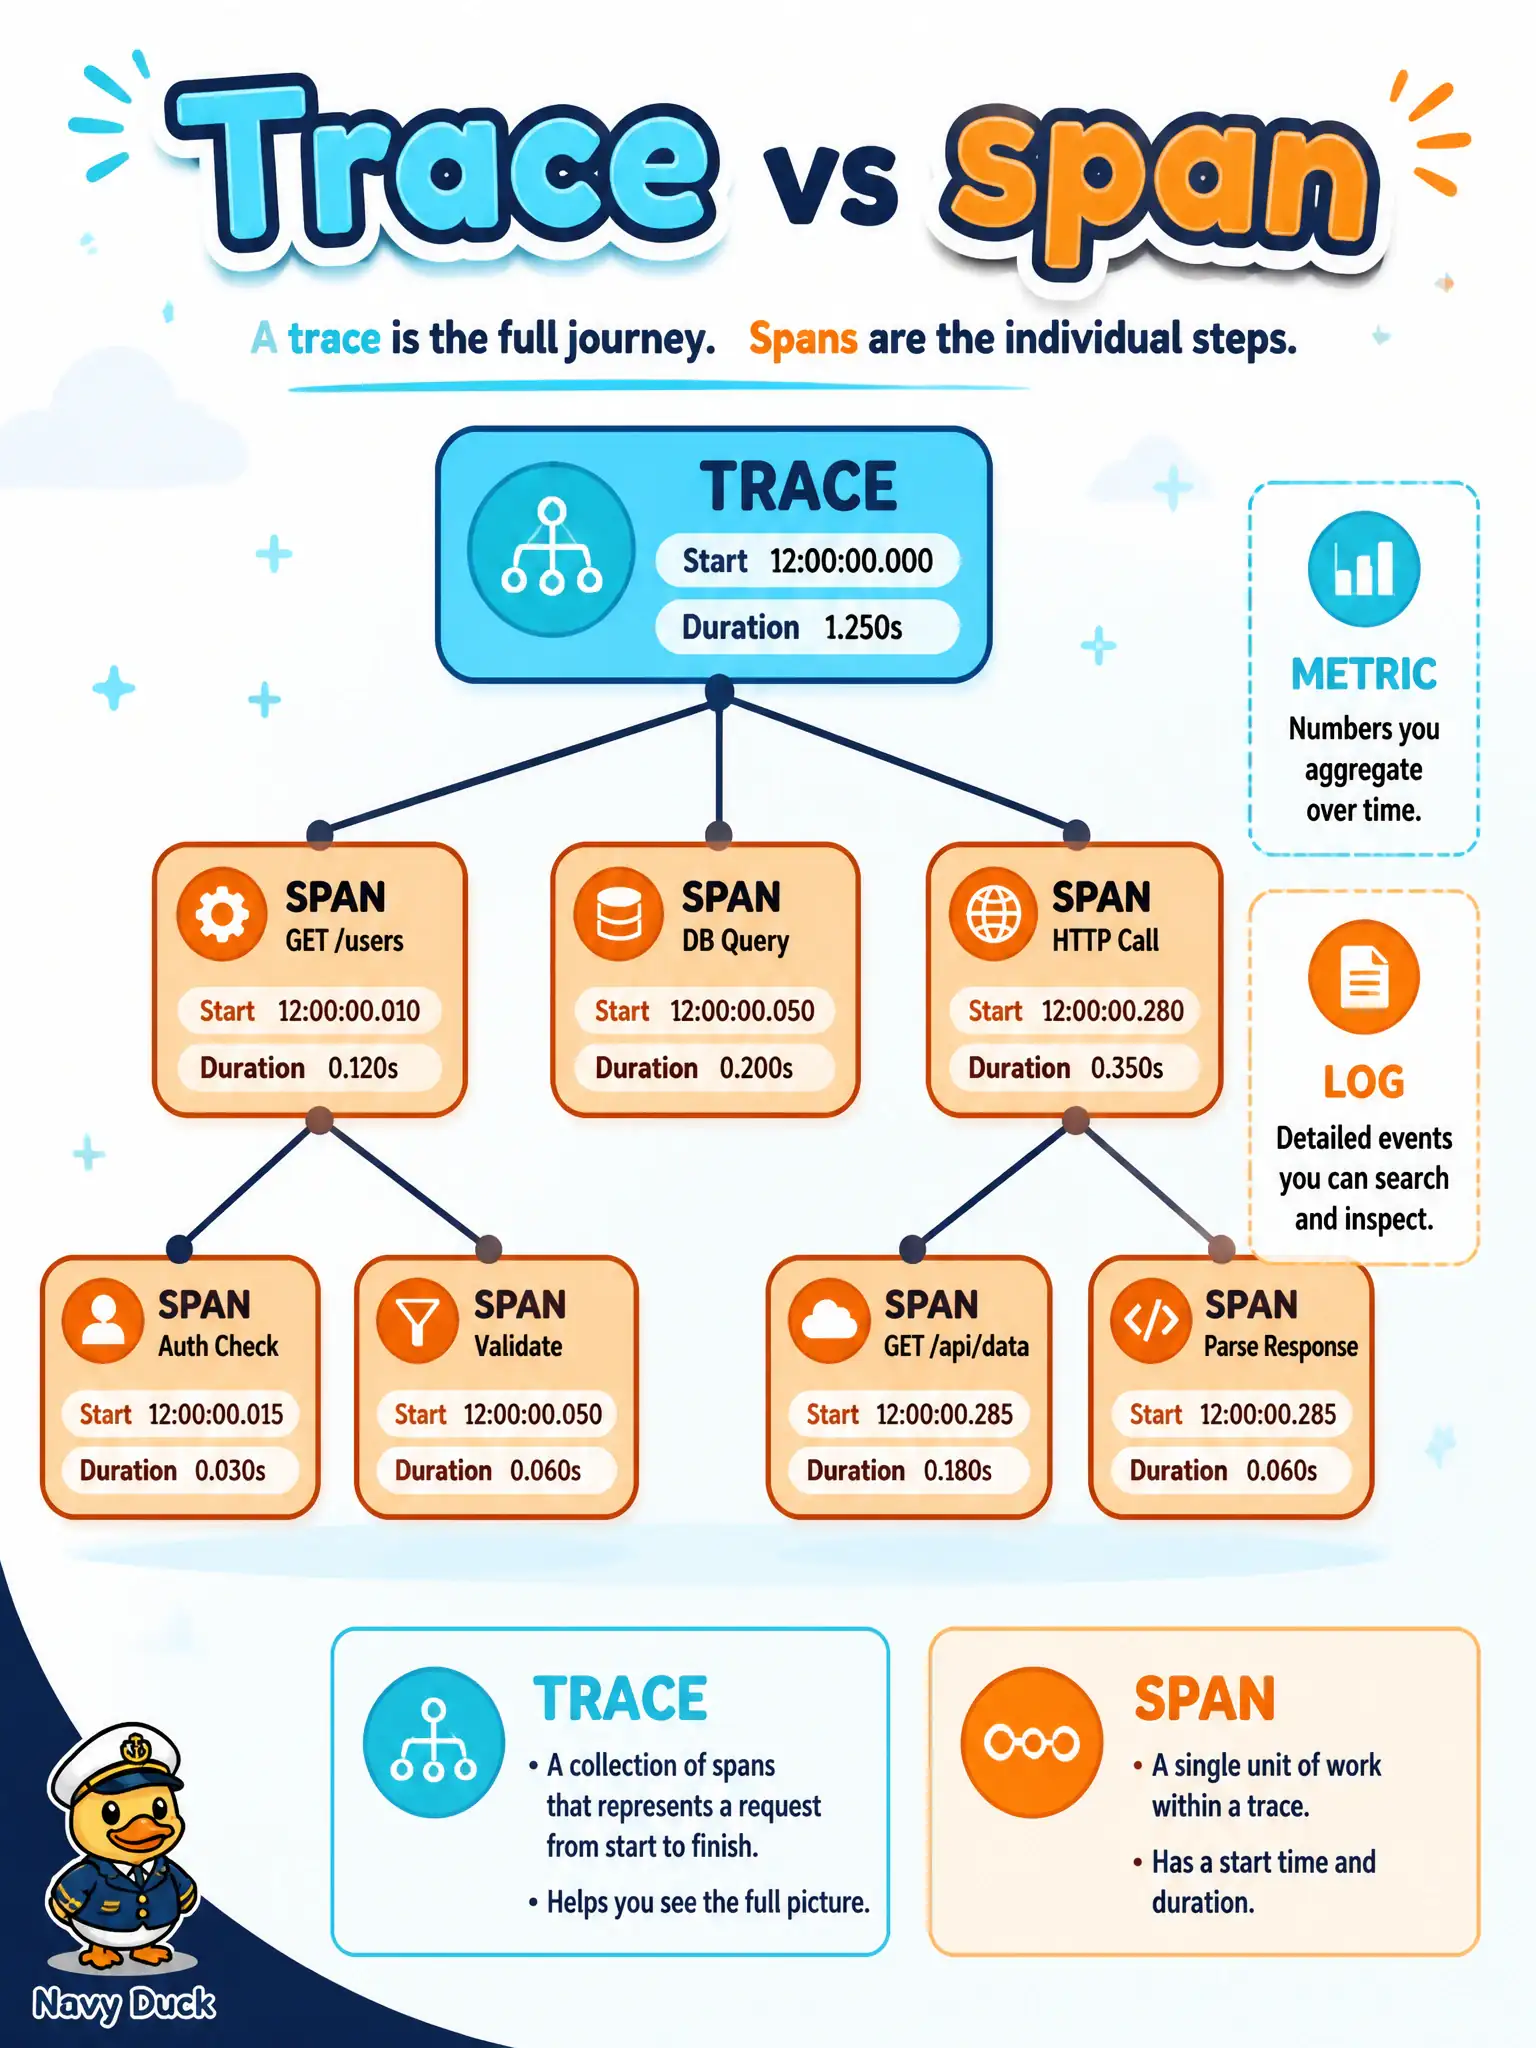
A trace is the whole journey map; each span is one labeled stopwatch on that map. Metrics and log lines are different kinds of evidence.
Full Explanation
In APM and Functions terminology, a trace is the full request flow through the distributed system—a tree of related spans that together tell the story of one logical request. A span is one named operation within that tree, carrying a start time and duration (and typically relationship to a parent). For a grants portal Function review, confusing those terms leads to wrong expectations about what Trace Explorer shows versus what a single timing sample means.
Saying a span is the entire distributed request while a trace is only a single metric data point reverses the definitions and mixes tracing with Monitoring metrics. Calling a trace always one log line and a span an alarm destination conflates Logging and Notifications with APM concepts. Claiming a span replaces Monitoring namespaces and a trace replaces Logging log groups invents product substitutions that do not exist—these observability pillars remain distinct.
Exam caveat: default function-invocation spans form the outer shell of a trace; inner work appears as additional spans only when instrumented or emitted by participating components. Operational check: open one grants-portal invocation in Trace Explorer, identify the root/outer span versus child spans, and verify you can explain duration as sum/structure of spans—not as a Monitoring namespace rename.