
A water-utility OKE cluster shows citizen-portal pods stuck Pending while nodes report not Ready. Which Monitoring approach matches what OCI emits automatically for the cluster and nodes?
Select an answer to reveal the explanation.
Short Explanation
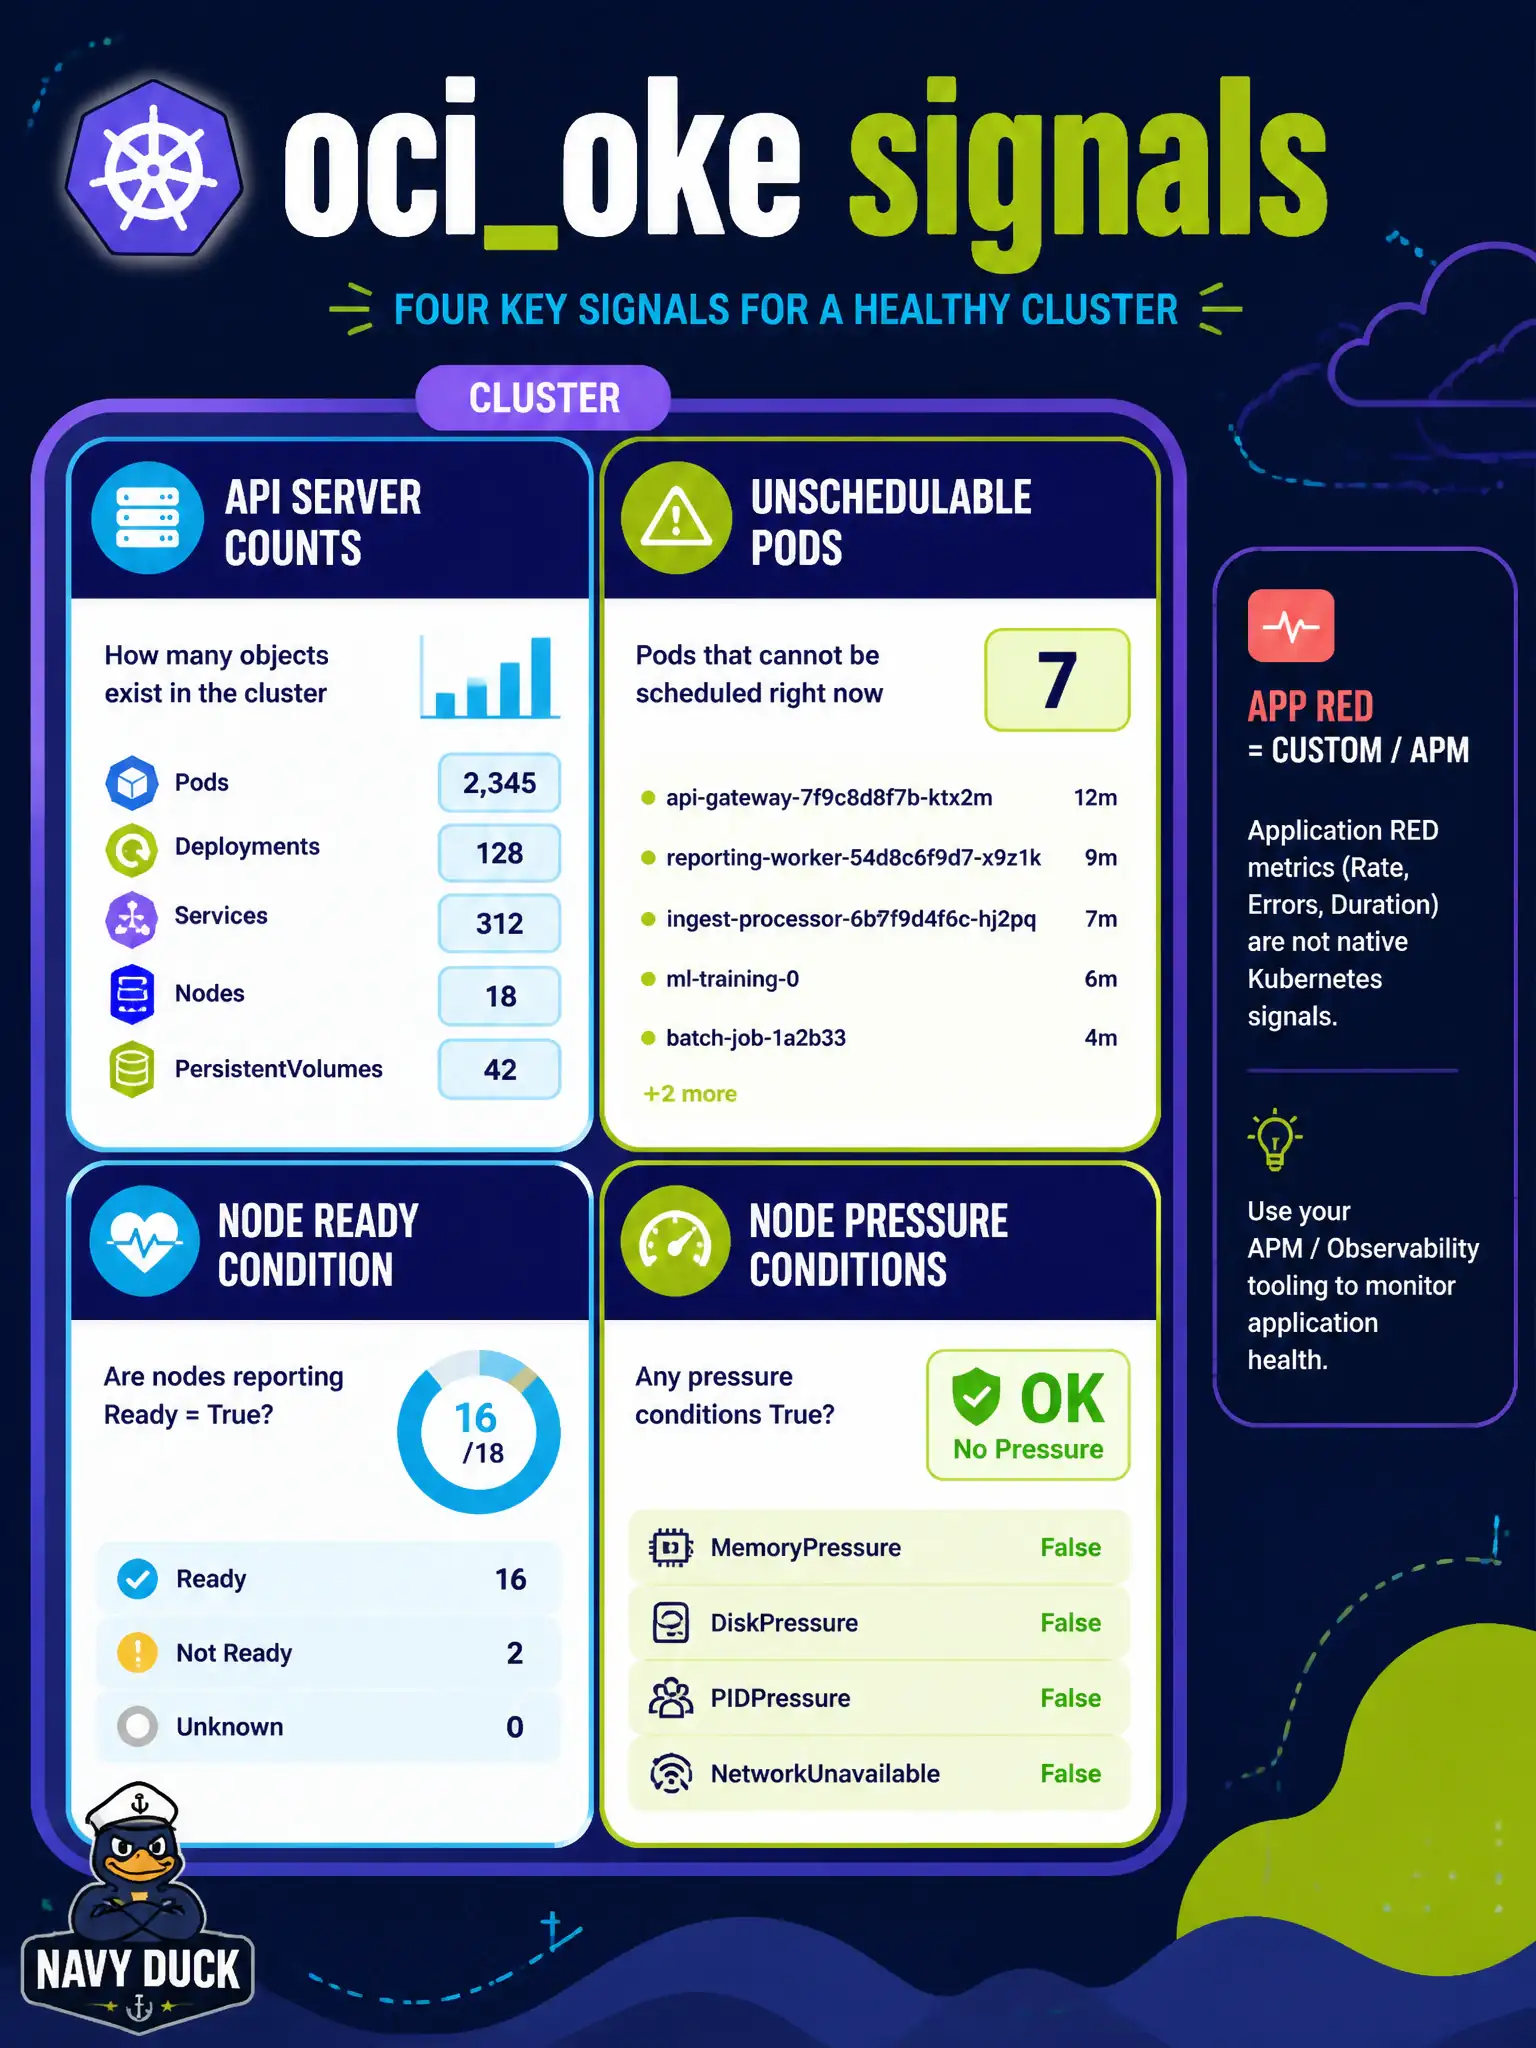
oci_oke is the cluster’s built-in dashboard for control plane and nodes—scheduling stuck pods and Ready pressure live there. Your app’s own RED numbers are custom metrics or APM, not those OKE figures.
Full Explanation
Oracle Kubernetes Engine automatically emits cluster and node signals in the oci_oke Monitoring namespace. For a water-utility cluster where citizen-portal pods sit Pending and nodes report not Ready, that namespace is the correct place for API server request counts, unschedulable pod metrics, node state, and Kubernetes node conditions. Those platform metrics exist without you publishing custom RED series; they describe control-plane and node health that scheduling depends on.
Querying only oci_faas FunctionError metrics looks at Oracle Functions errors, not Kubernetes scheduling or node Ready state—wrong service namespace for this symptom. Treating RED metrics from the application process as if they were oci_oke control-plane signals confuses app-emitted custom or APM data with the cluster’s built-in platform metrics; your process rate/error/duration never substitutes for unschedulable-pod or node-condition series. Using API Gateway IntegrationLatency as a stand-in for node Ready conditions measures backend time behind a gateway, not whether workers can accept pods.
Exam caveat: oci_oke tells you the cluster and nodes are unhealthy or saturated; it does not replace application logs or APM for why the app code itself fails after a pod is Running. Operational check: in Metrics Explorer, select namespace oci_oke, confirm series for unschedulable pods and node conditions during the Pending window, and correlate timestamps with kubectl/node Ready before chasing Functions or gateway latency.