
A civic operations board needs numeric invoke rates and threshold alerts for Oracle Functions, plus separate stores for log lines and distributed traces. Which OCI service holds metrics and alarms?
Select an answer to reveal the explanation.
Short Explanation
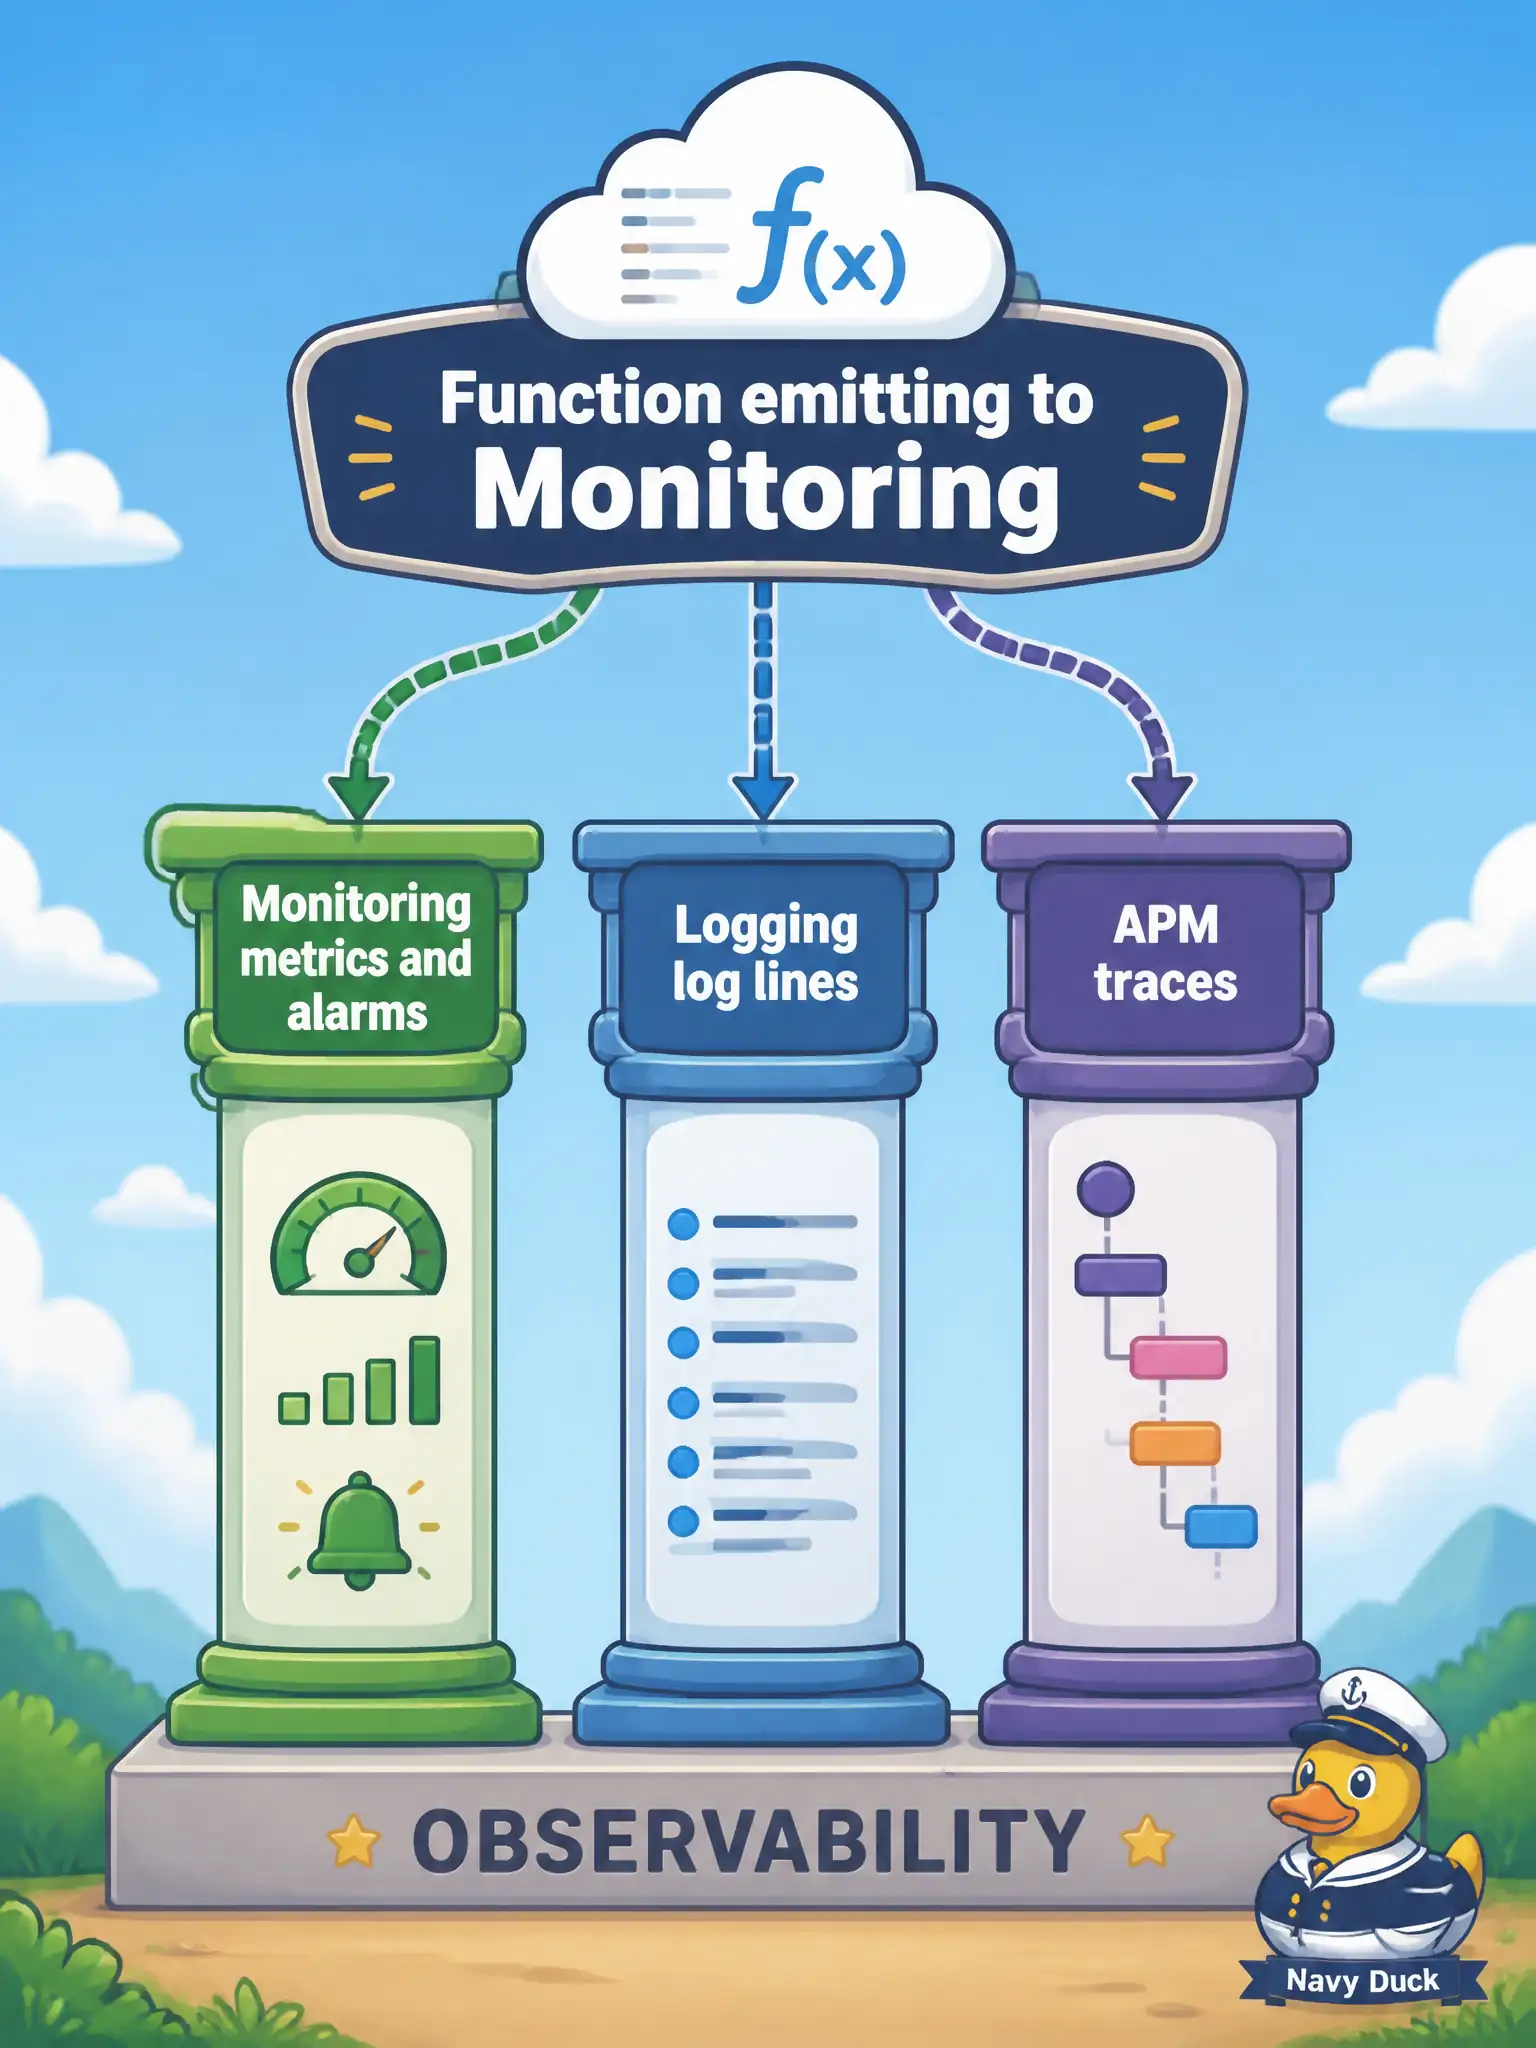
Monitoring is the scoreboard and buzzer; Logging is the diary; APM is the trip map. Pick Monitoring when you need metrics and alarms.
Full Explanation
Numeric invoke rates and threshold alerts for Oracle Functions belong in OCI Monitoring. Monitoring stores timestamped metric data points (with dimensions) in metric namespaces, supports aggregate queries, and evaluates alarm queries when conditions stay true. Log lines belong in Logging, and distributed traces belong in Application Performance Monitoring (APM). The civic operations board therefore uses Monitoring for metrics and alarms while keeping logs and traces in their own stores rather than overloading one service to do all three.
Choosing Logging because metric namespaces and alarms are supposedly stored as log records confuses telemetry types: logs are event text/records, not the metric time-series and alarm evaluator Monitoring provides. Choosing APM only because it supposedly replaces Monitoring for Functions is wrong—APM complements with traces/spans; it does not replace oci_faas metrics and Monitoring alarms. Choosing Streaming because alarms are published exclusively as Kafka-compatible messages misstates alarm evaluation; Streaming may receive notifications downstream but is not the metrics-and-alarms service of record.
Exam caveat: alarms watch Monitoring queries—if the wrong namespace or dimension filter is used, alarms stay silent even when Logging shows errors. Operational check: open Monitoring for a civic Function, confirm invoke-related metrics appear, create a test alarm on an invocation or error threshold, trigger a controlled load, and verify the alarm transitions while confirming logs still appear under Logging and traces under APM if enabled.