
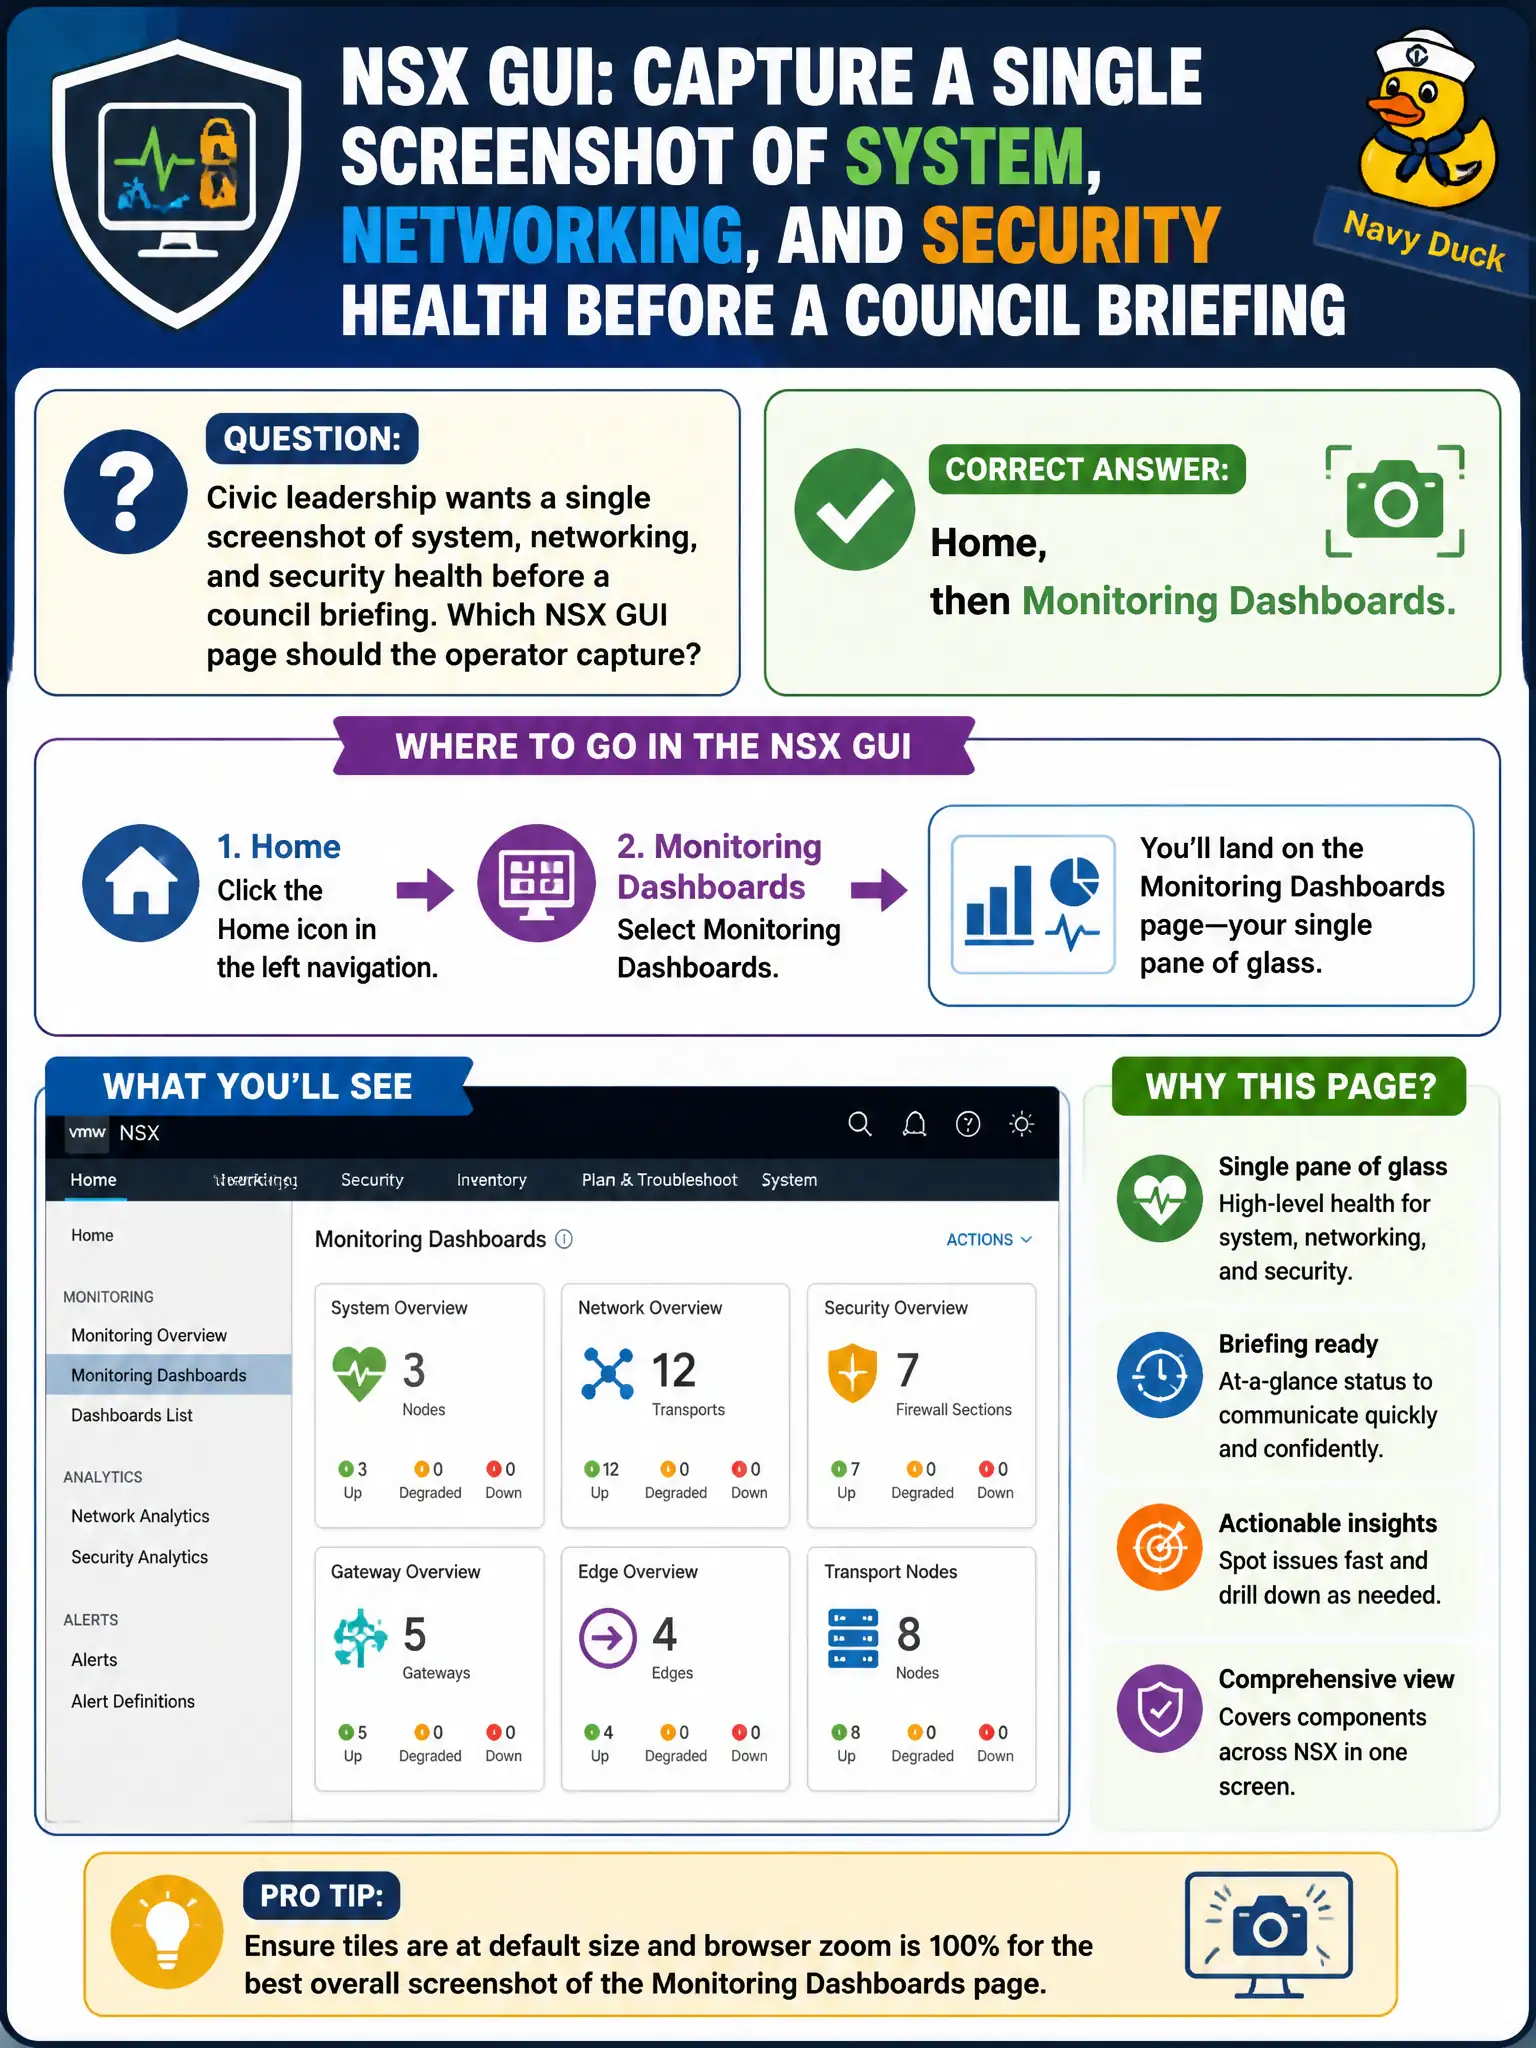
Civic leadership wants a single screenshot of system, networking, and security health before a council briefing. Which NSX GUI page should the operator capture?
Select an answer to reveal the explanation.
Short Explanation
Council wants the civic status wall, not a picture of one host or an EDR device list. Home Monitoring Dashboards is that wall for system, networking, and security together.
Full Explanation
Civic leadership that wants a single screenshot of system, networking, and security health before a council briefing should capture Home → Monitoring Dashboards—the consolidated NSX status wall for those domains. One ESXi Host Client screenshot from a random transport host shows a single host, not fabric-wide NSX health. The vSphere content library home page stores templates and ISOs, not NSX monitoring. The Carbon Black Cloud device list reports endpoints, not NSX system/networking/security dashboards. Exam caveat: dashboards reflect current alarms and metrics; capture after confirming no stale browser session and note the timestamp for the council packet. Operational check: open Home → Monitoring Dashboards, verify system, networking, and security widgets populate, take the screenshot for leadership, and attach it to the briefing with the Manager FQDN and time. In municipal operations, record the chosen control and the rejected alternatives in the change ticket so future on-call staff understand which failure modes would affect city services. Re-validate after the next maintenance window that the same GUI path and realized state still hold under the current NSX build used by the civic platform team.