
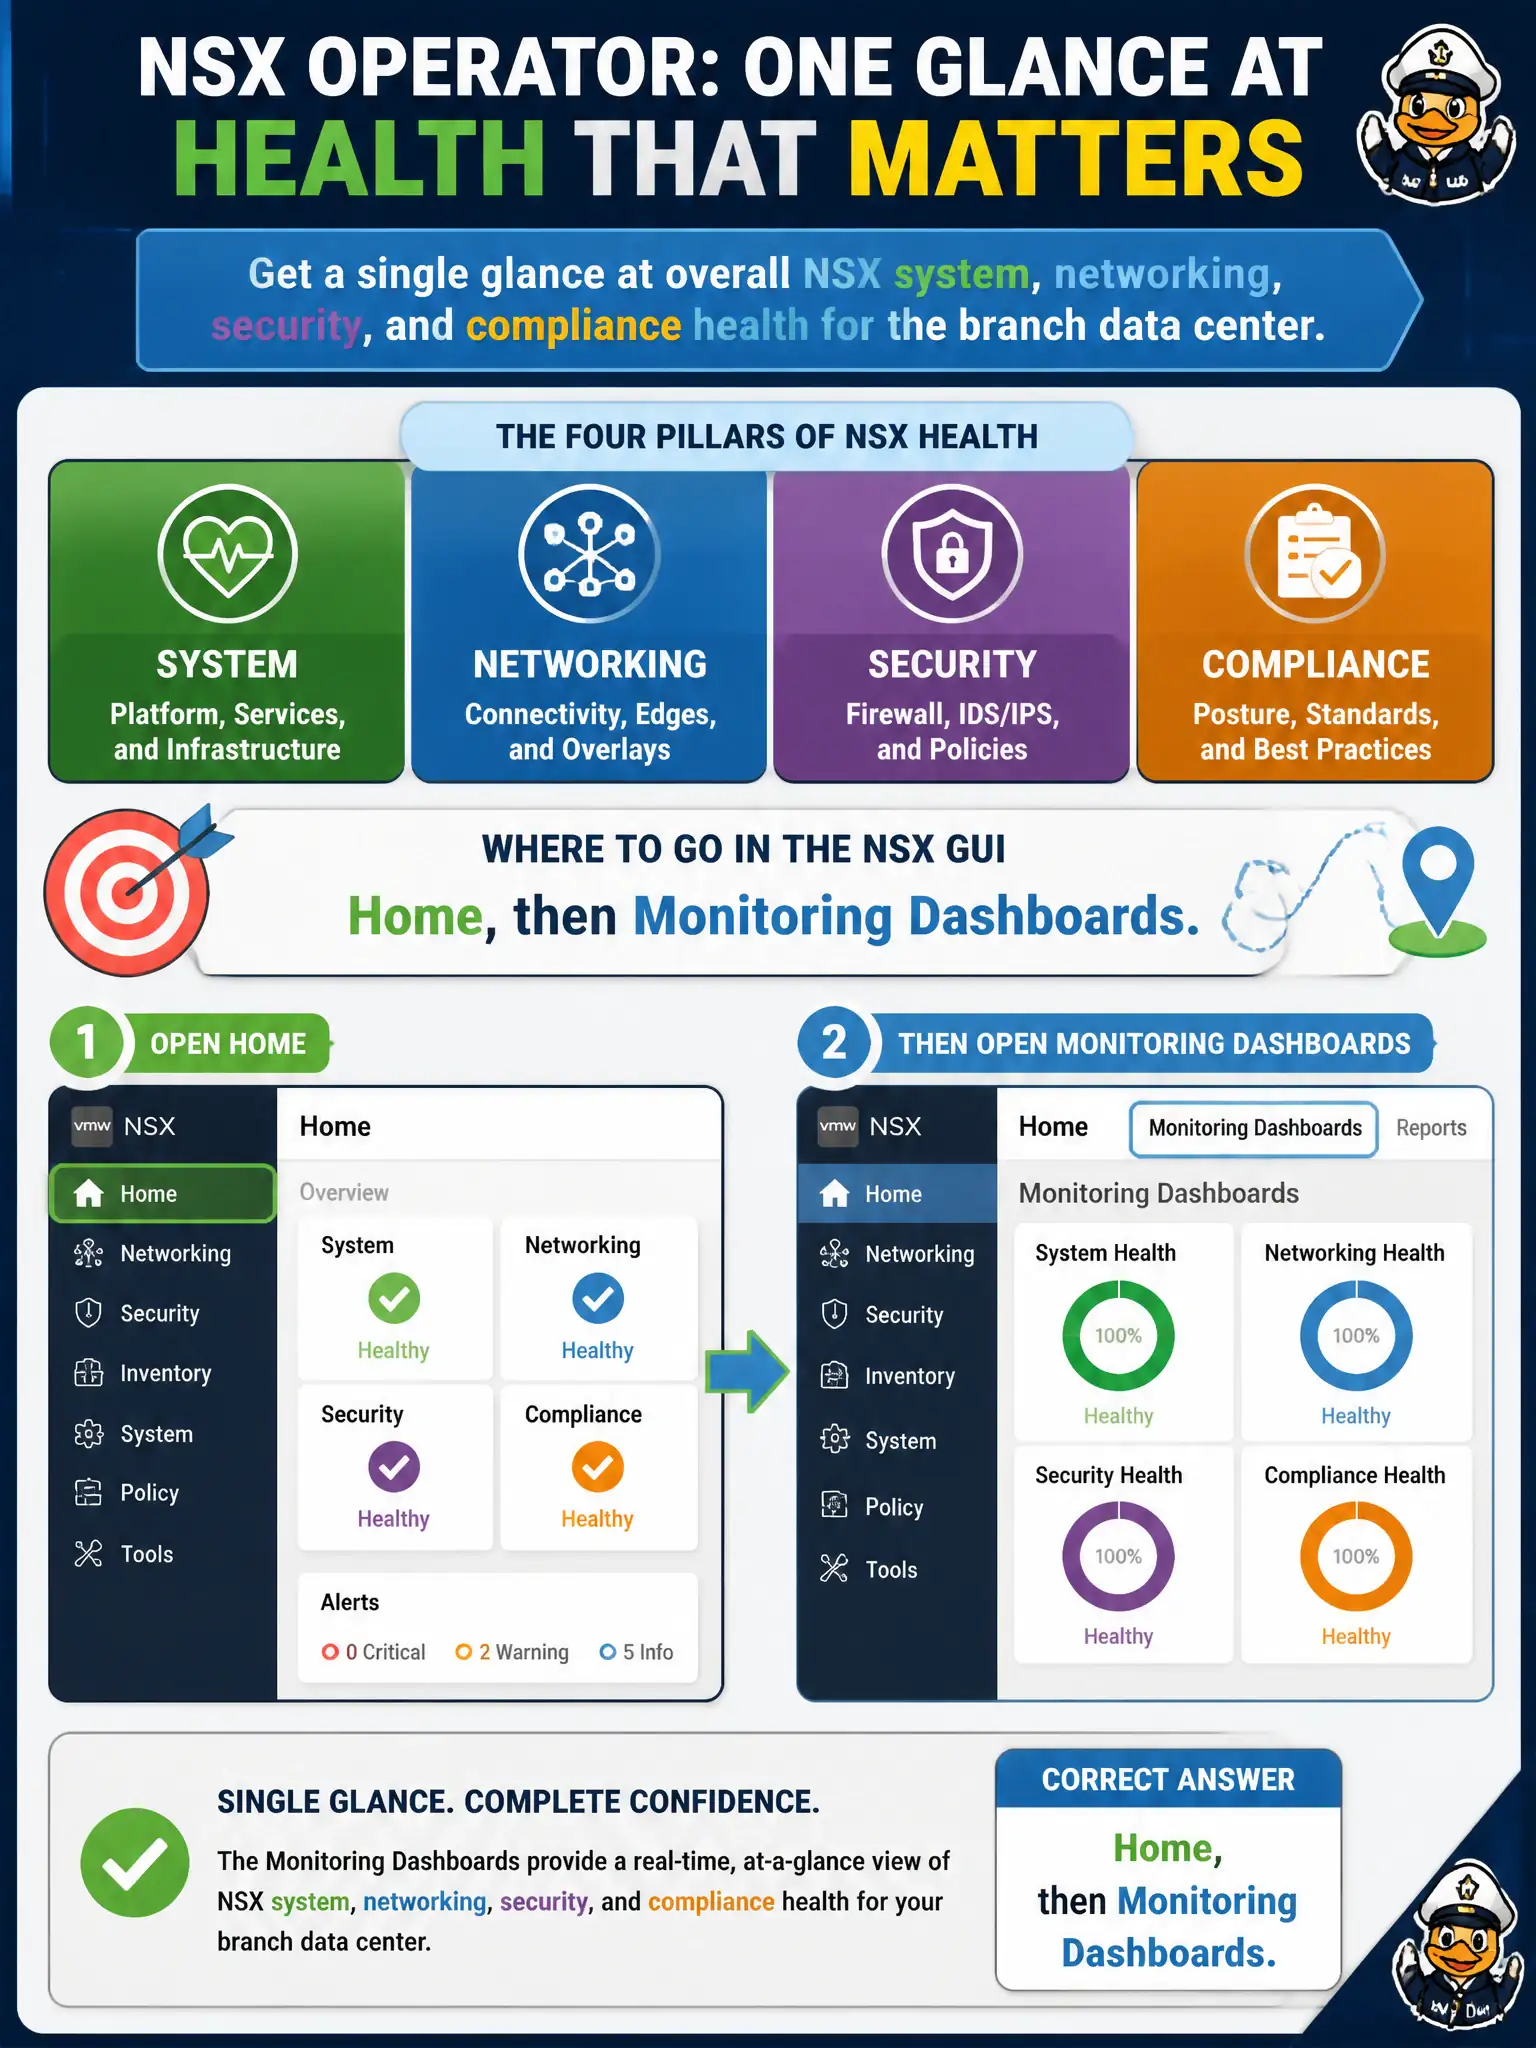
A library operator needs a single glance at overall NSX system, networking, security, and compliance health for the branch data center. Which NSX GUI location should the operator open?
Select an answer to reveal the explanation.
Short Explanation
The library wants the front-desk status board, not a dive into one firewall drawer. Home, then Monitoring Dashboards, is that board for system, networking, security, and compliance. DFW Ethernet, Horizon session reports, and vSAN Skyline are different products or different rooms.
Full Explanation
NSX Manager Home Monitoring Dashboards summarize system, networking and security, and compliance status so a library operator can glance at overall branch data-center health. That is the front-desk status board, not a dive into one firewall drawer. Security then Distributed Firewall then Ethernet is a rule category path, not a health overview. Horizon Cloud session reports belong to end-user computing. vSAN Skyline Health in the vSphere Client reports storage, not NSX fabric health. Exam caveat: dashboards summarize; deep alarms and object status may still require drill-down, but the GUI location for the single-glance overview is Home Monitoring Dashboards. Operational check: open Home then Monitoring Dashboards, confirm widgets for system, networking/security, and compliance, and verify DFW Ethernet, Horizon reports, and vSAN Skyline were not used as the NSX overview. Document the civic rationale in the change record so the next operator can restate why the correct control matches the agency outcome, why each distractor fails by concept, and which NSX Manager view confirms the result after publish. Document the civic rationale in the change record so the next operator can restate why the correct control matches the agency outcome, why each distractor fails by concept, and which NSX Manager view confirms the result after publish.