
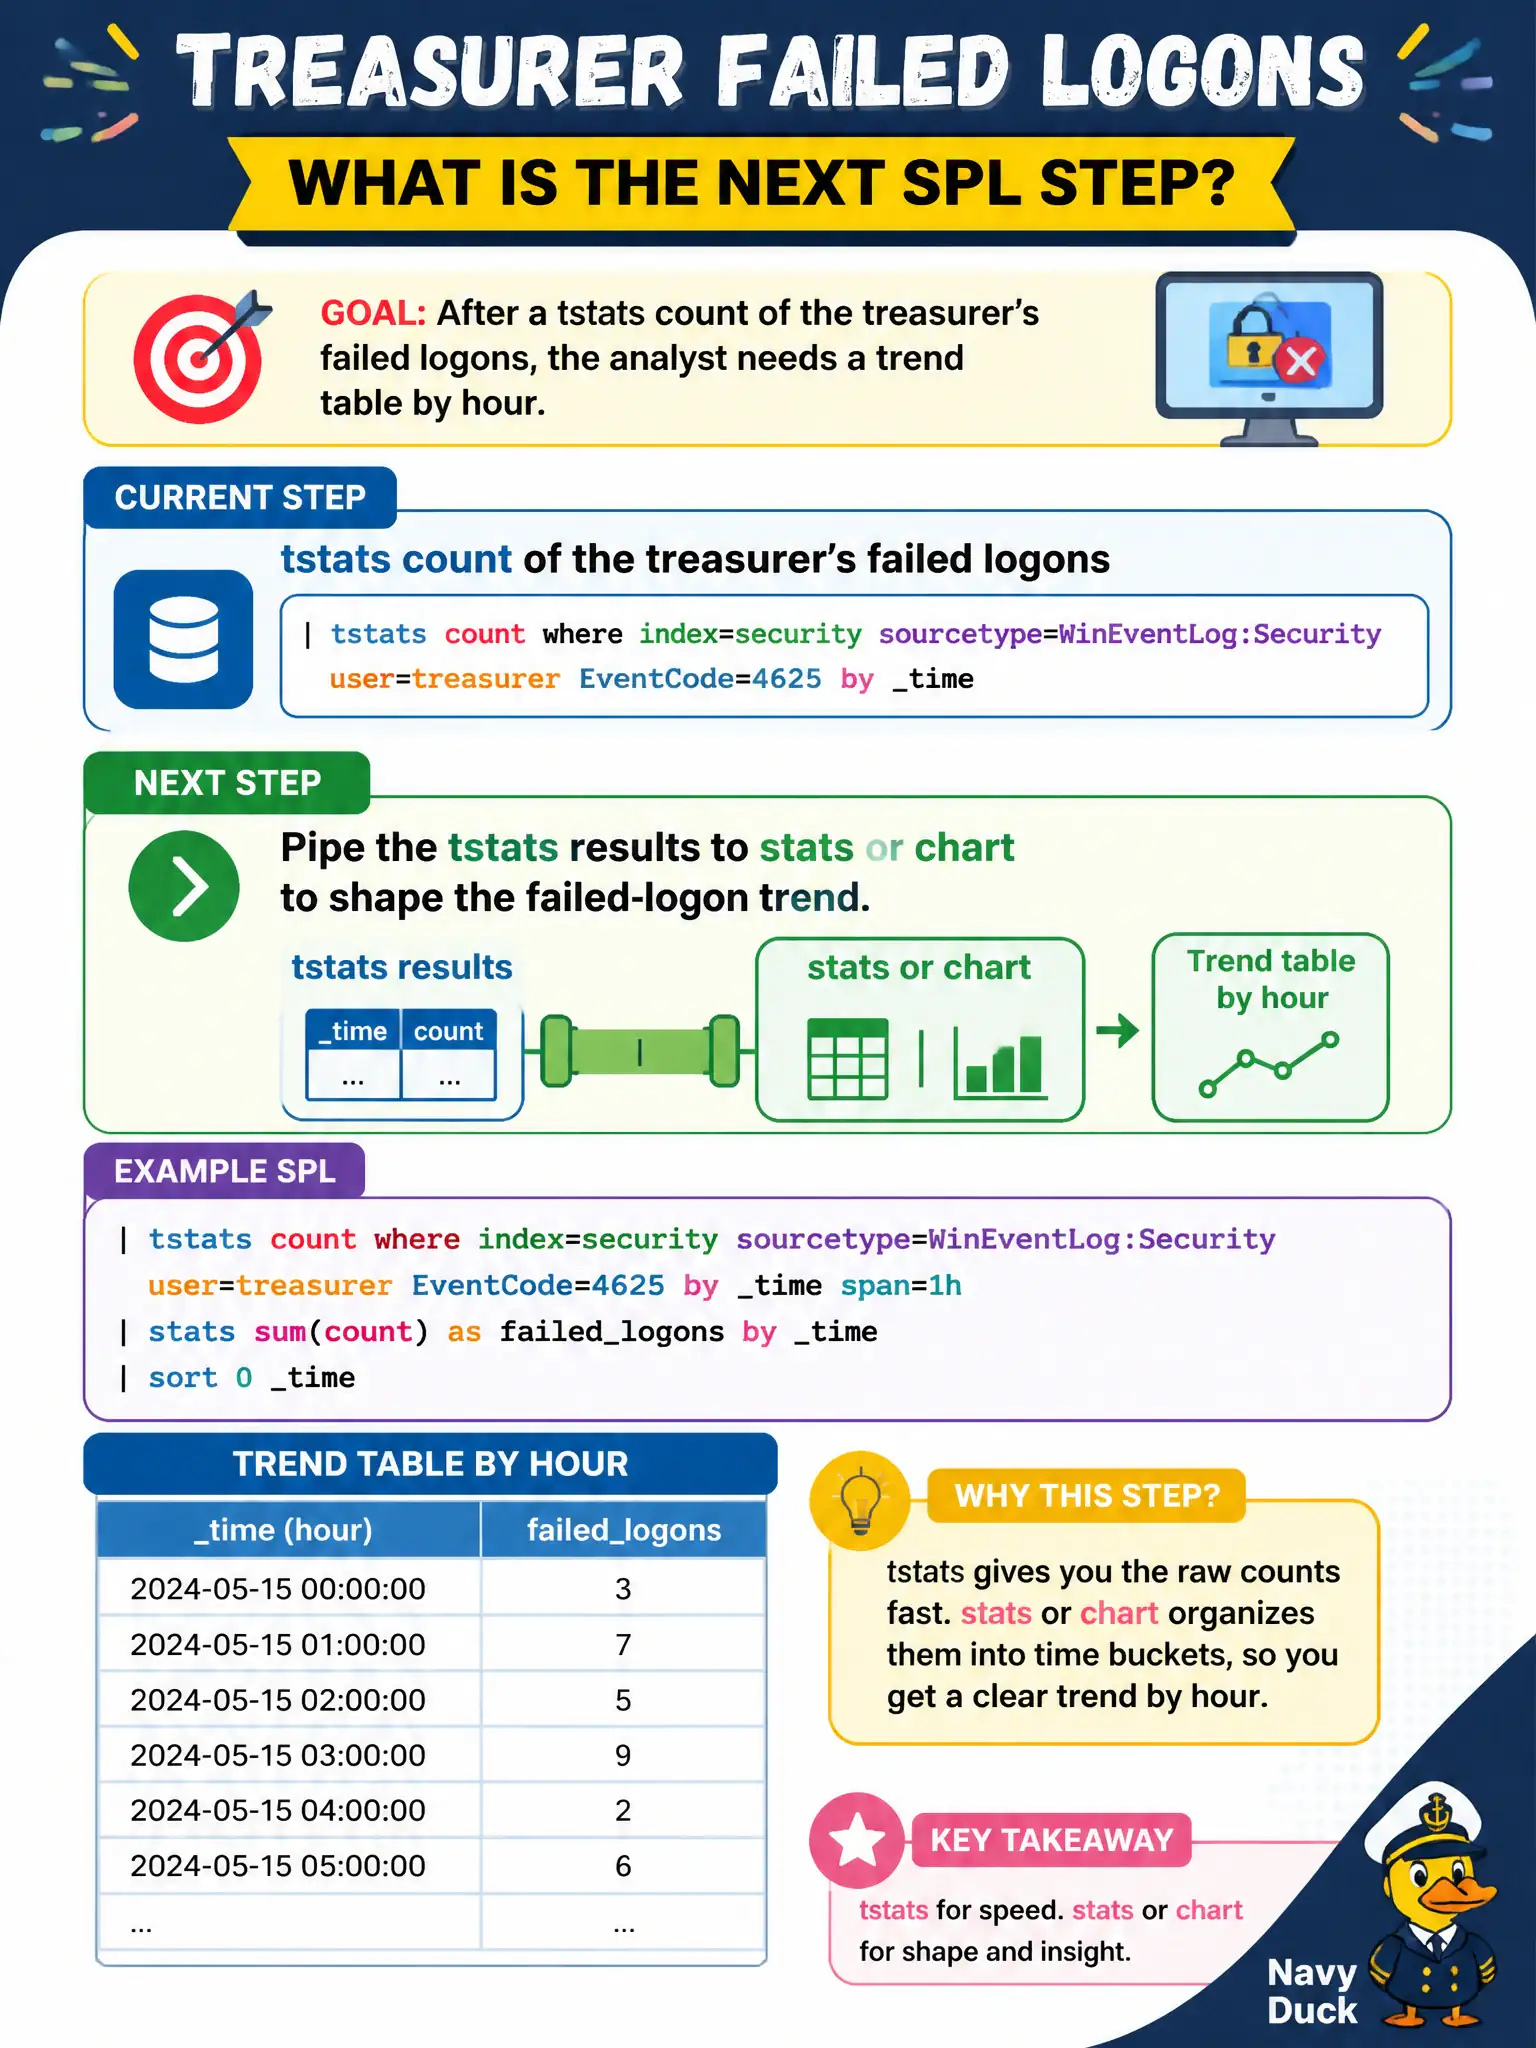
After a tstats count of the treasurer's failed logons, the analyst needs a trend table by hour. What is the next SPL step?
Select an answer to reveal the explanation.
Short Explanation
tstats hauls the bricks; stats or chart builds the wall. After the accelerated count, pipe it into a transforming command for the treasurer's hourly trend. tstats is not a fancy rex.
Full Explanation
In Splunk Enterprise Security for a municipal SOC, tstats returns summarized rows that usually still need a transforming command to become an investigation-ready trend. After counting the treasurer’s failed logons with tstats, piping those results to stats or chart shapes the failed-logon trend by hour for briefing and timeline analysis. Replacing tstats with rex because only rex can draw a trend fails by concept because rex extracts fields from strings; it does not replace summarized aggregates or charting transforms. Stopping the search on the claim that tstats is already a drop-in field extractor and needs no transforming command fails by concept because tstats is a summary aggregation tool, not a field extractor, and trends typically need stats or chart. Sending the raw tstats output to a new index so dashboards can reread syslog fails by concept because re-indexing summary output is unnecessary overhead and confuses data management with SPL shaping. Exam caveat: SPLK-5001 expects analysts to combine tstats with stats or chart when they need a civic security trend table, not to treat tstats as a complete visualization or as rex. Operational check: pipe the treasurer failed-logon tstats into chart or stats by hour, validate the peak hours against a sample of raw events, save the search for the finance SOC dashboard, and avoid writing intermediate results to a new index.