
PROC ASSESS with the FITPLOT option is run after logistic regression. What does the FITPLOT produce?
Select an answer to reveal the explanation.
Short Explanation
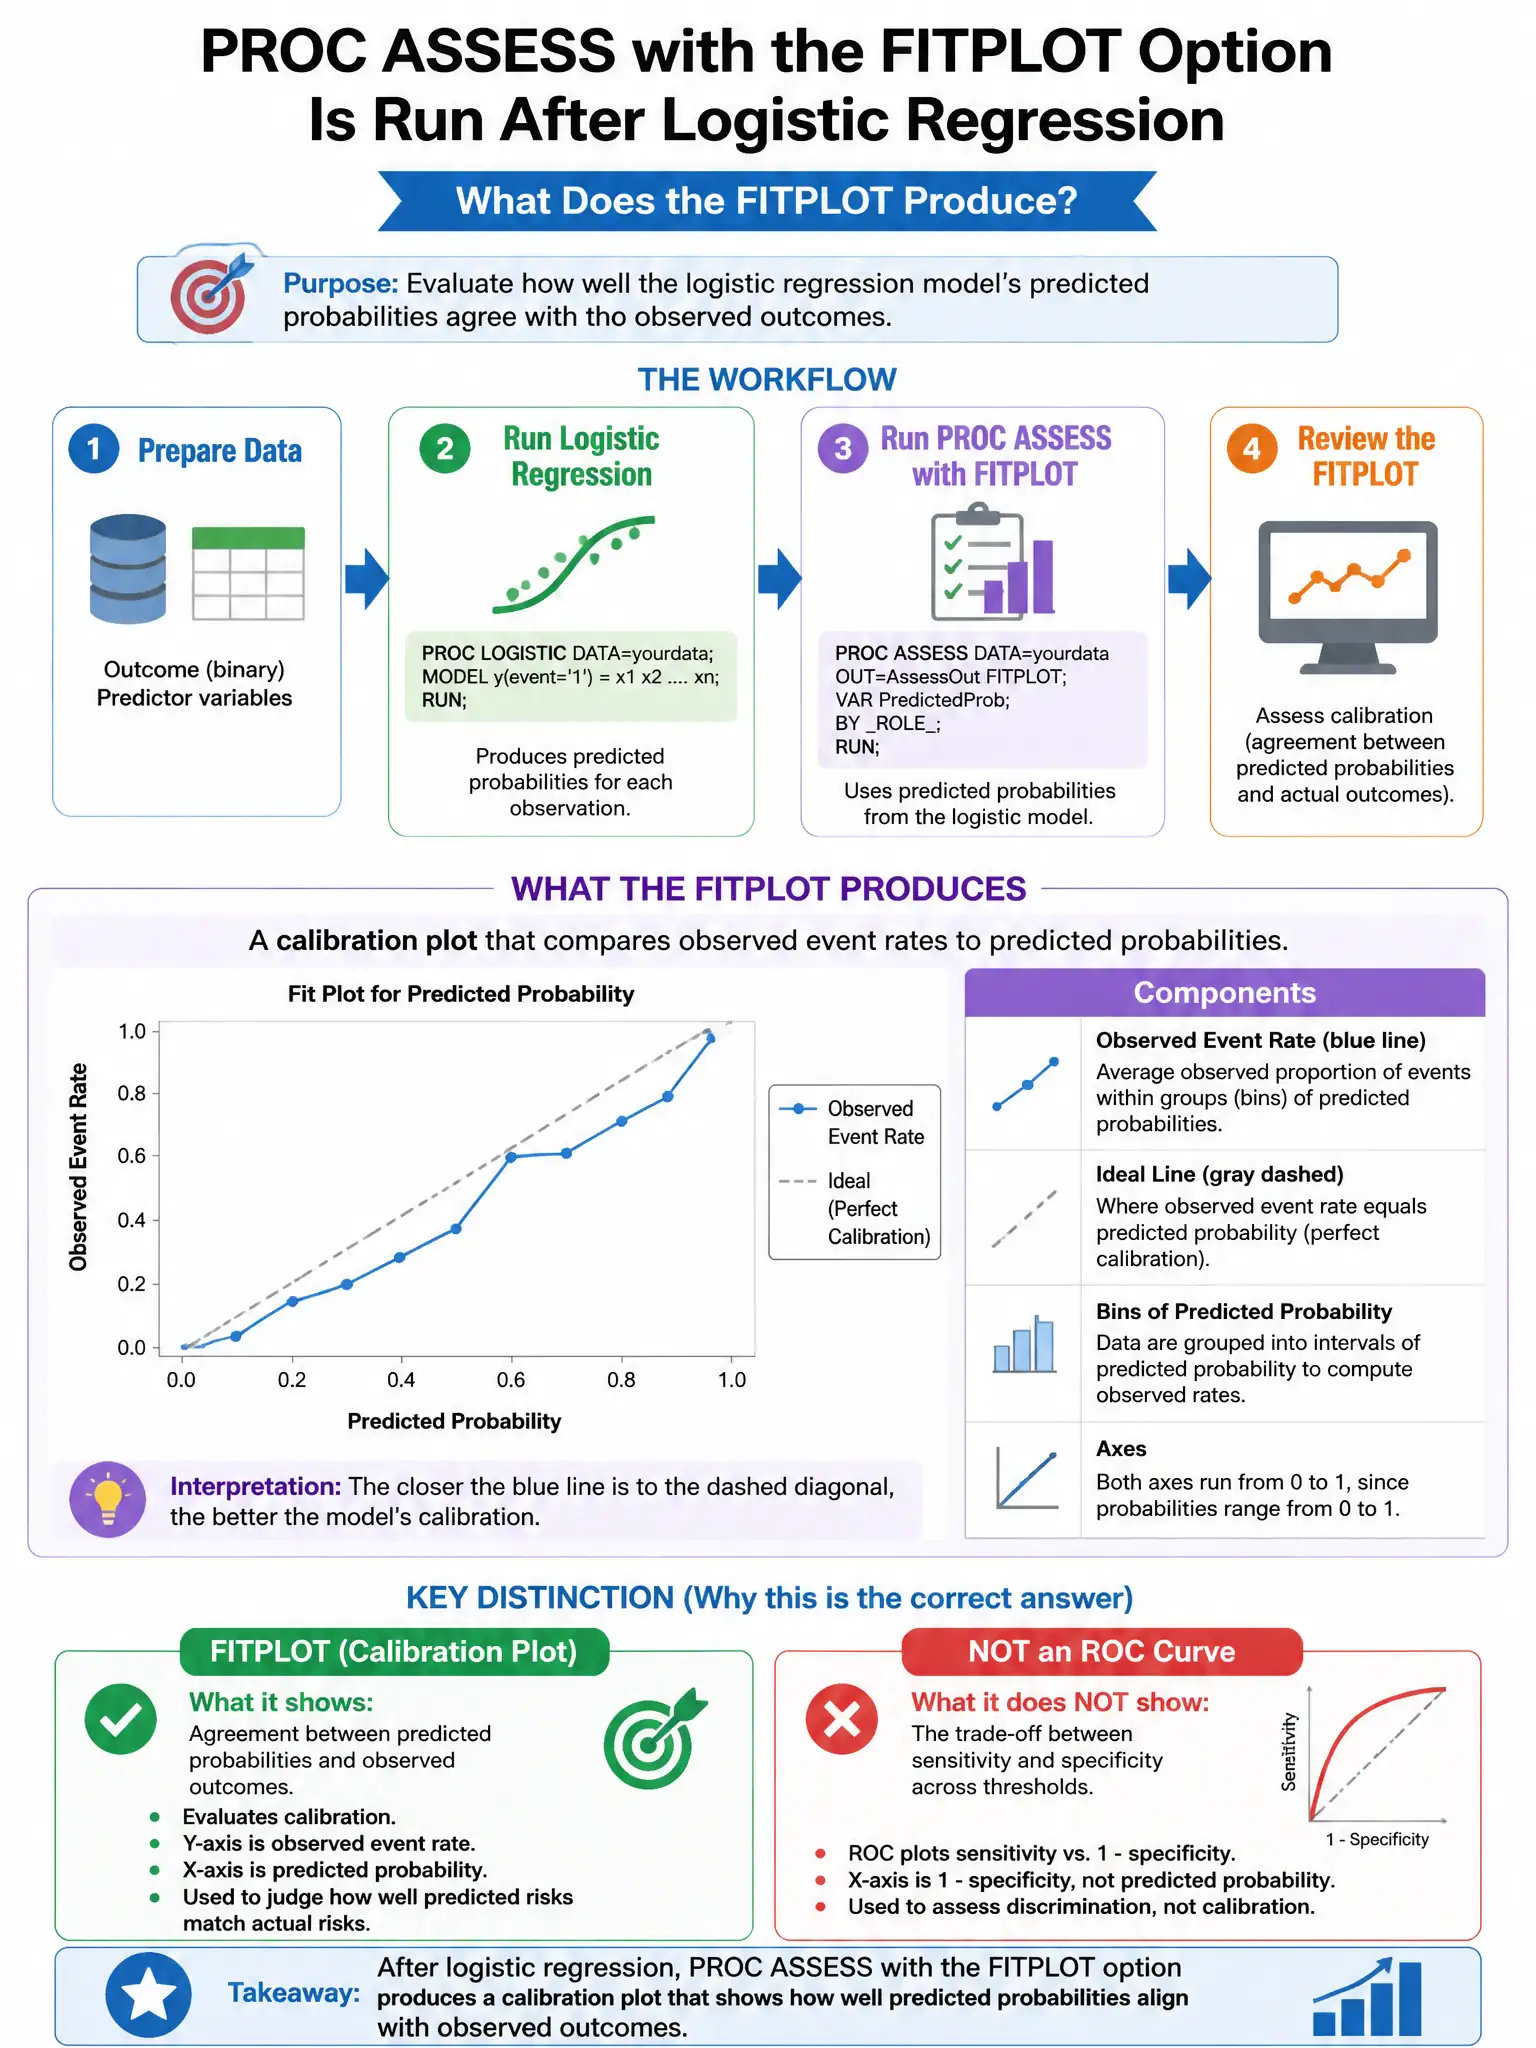
Here's the deal — PROC ASSESS with FITPLOT gives you a calibration plot that compares observed event rates to mean predicted probabilities across score deciles. You use it to see whether the model's predicted probabilities line up with what actually happened.
Full Explanation
The calibration plot showing observed event rates versus mean predicted probabilities across score deciles is correct because PROC ASSESS with FITPLOT compares observed event frequencies to model-predicted probabilities grouped into bands, enabling visual calibration assessment. The residual scatter plot describes linear regression diagnostics. The ROC curve with optimal threshold comes from ROC analysis, such as PROC LOGISTIC. The predicted-probability histograms are separate diagnostic plots.