
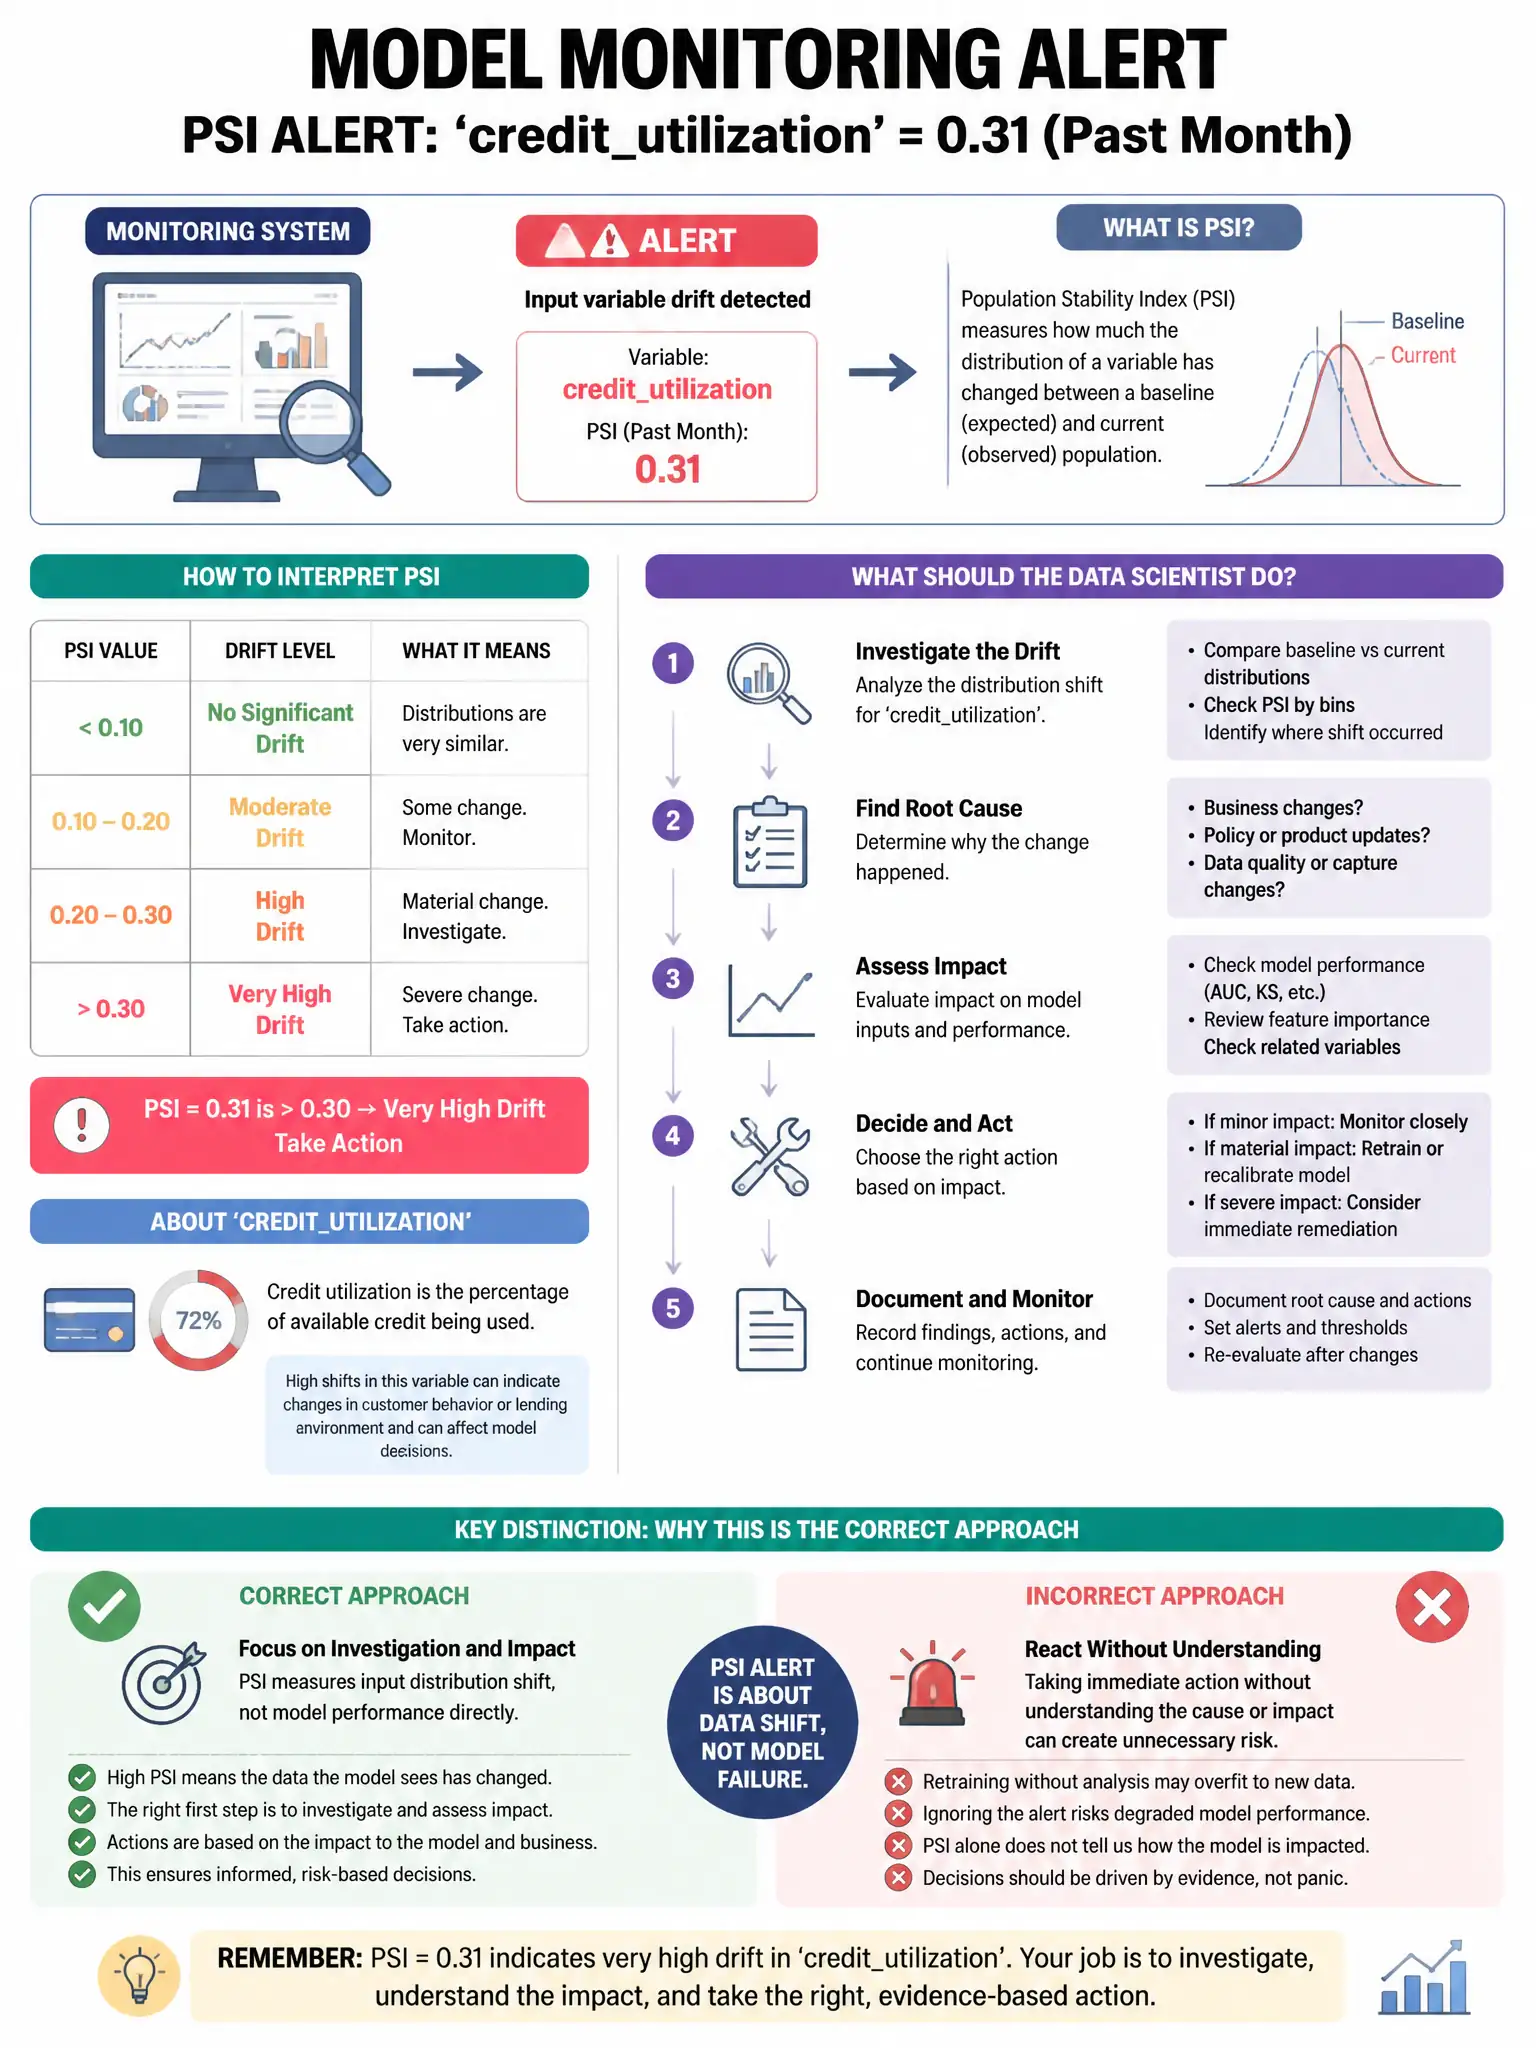
A model monitoring system in SAS detects that input variable 'credit_utilization' has a PSI (Population Stability Index) of 0.31 over the past month. How should the data scientist interpret this?
Select an answer to reveal the explanation.
Short Explanation
Here's the deal — a PSI of 0.31 is above 0.25, so the credit_utilization distribution has shifted significantly. You should investigate the cause and consider retraining the model.
Full Explanation
The correct interpretation is that the distribution of credit_utilization has shifted significantly because PSI > 0.25, so investigate the cause and consider retraining. Standard PSI thresholds are: <0.10 stable, 0.10-0.25 moderate shift (monitor), >0.25 significant shift (investigate/retrain). A PSI of 0.31 exceeds 0.25, showing substantial drift from the training distribution, which may degrade model performance. The stable-distribution reading uses the wrong threshold. The slight-change reading also uses the wrong range. The 31%-of-customers reading misinterprets PSI as a customer proportion.