
A data engineer uses the t-SNE algorithm output from SAS to visualize high-dimensional customer segments. What is a key limitation of t-SNE that the engineer should communicate to stakeholders?
Select an answer to reveal the explanation.
Short Explanation
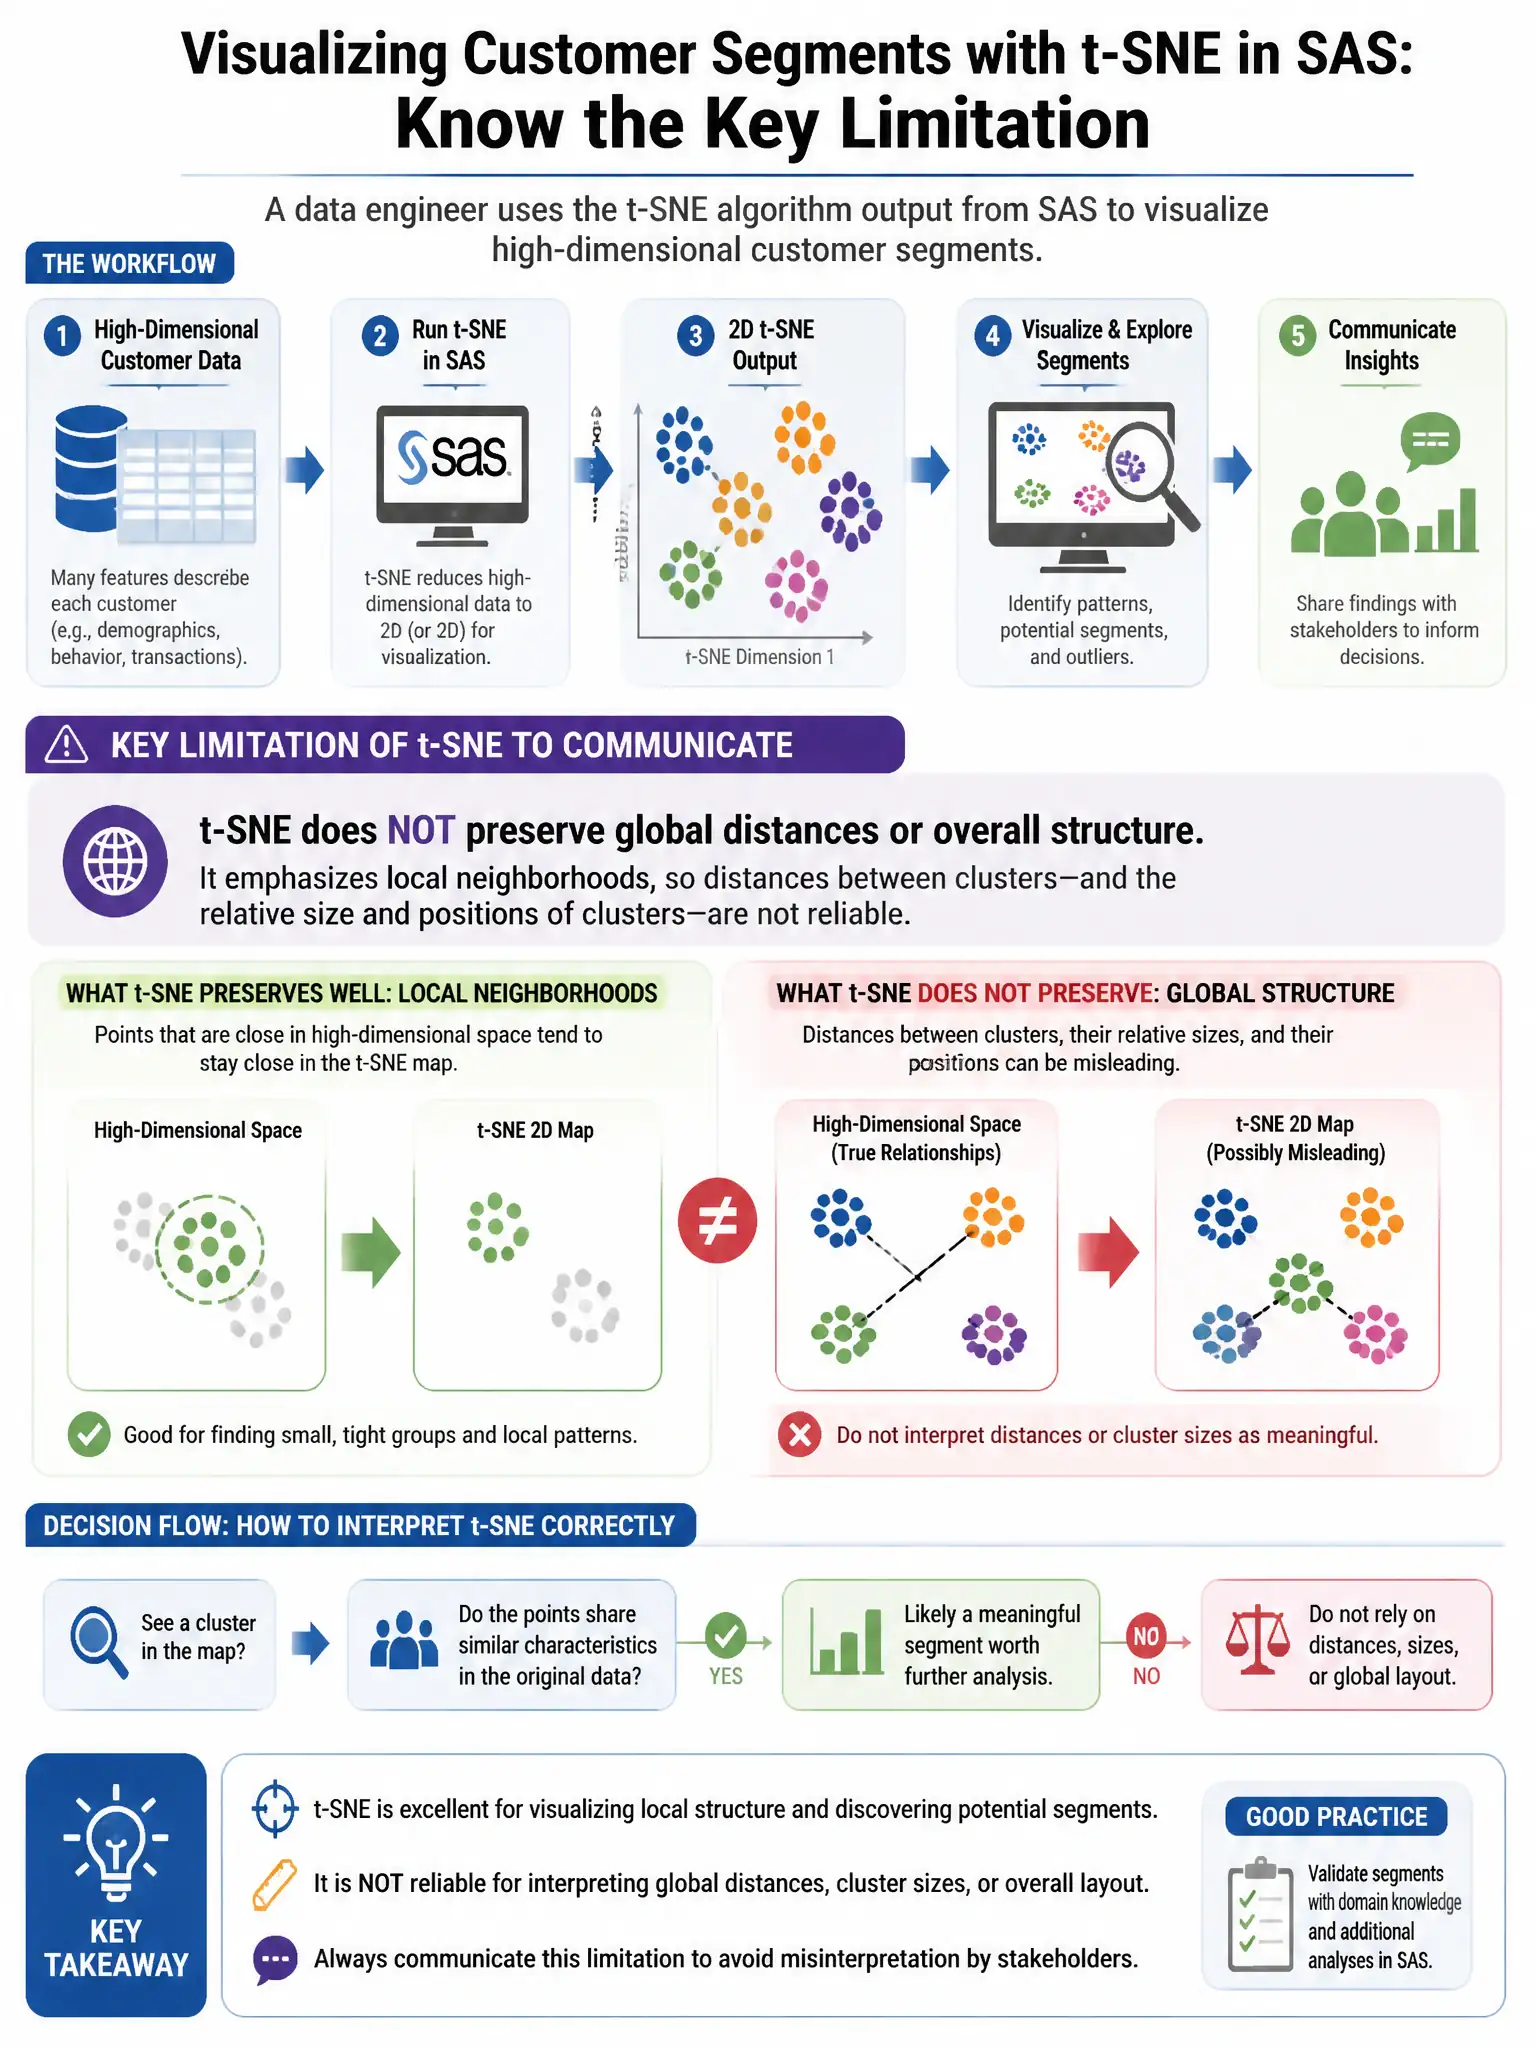
Here's the deal — t-SNE is great at showing local neighborhoods, but it can't reliably show how far apart clusters are from each other. It's also slow and computationally expensive on large datasets, so don't let stakeholders read cluster-to-cluster distances from the plot.
Full Explanation
The correct limitation is that t-SNE is computationally expensive for large datasets and does not preserve global distances well, making cluster-to-cluster relationships unreliable. t-SNE prioritizes local neighborhood structure, so nearby points stay nearby, but cluster positions and spacing can mislead stakeholders. It also has quadratic cost, so it is slow as data grows. The claim that t-SNE preserves global distances between cluster centers accurately is wrong because global structure is not guaranteed. The claim that t-SNE is deterministic and always produces the same layout is wrong because it is stochastic and random seeds can change layouts. The claim that t-SNE requires the number of clusters in advance like k-means is wrong because it is dimensionality reduction, not clustering.