
A machine learning team applies partial dependence plots (PDPs) to interpret a random forest model's relationship between 'customer_tenure' and predicted churn probability. The PDP shows a non-monotone U-shaped curve. What does this indicate?
Select an answer to reveal the explanation.
Short Explanation and Infographic
Here's the deal — b is correct because a PDP U-shape means the model's marginal effect of tenure on predicted churn probability has high values at both extremes (short tenure = new customers still deciding, long tenure = potentially bored/churning customers) with lower churn probability in the middle (satisfied, established customers). A is wrong; random forests can learn non-monotone effects.
Full explanation below image
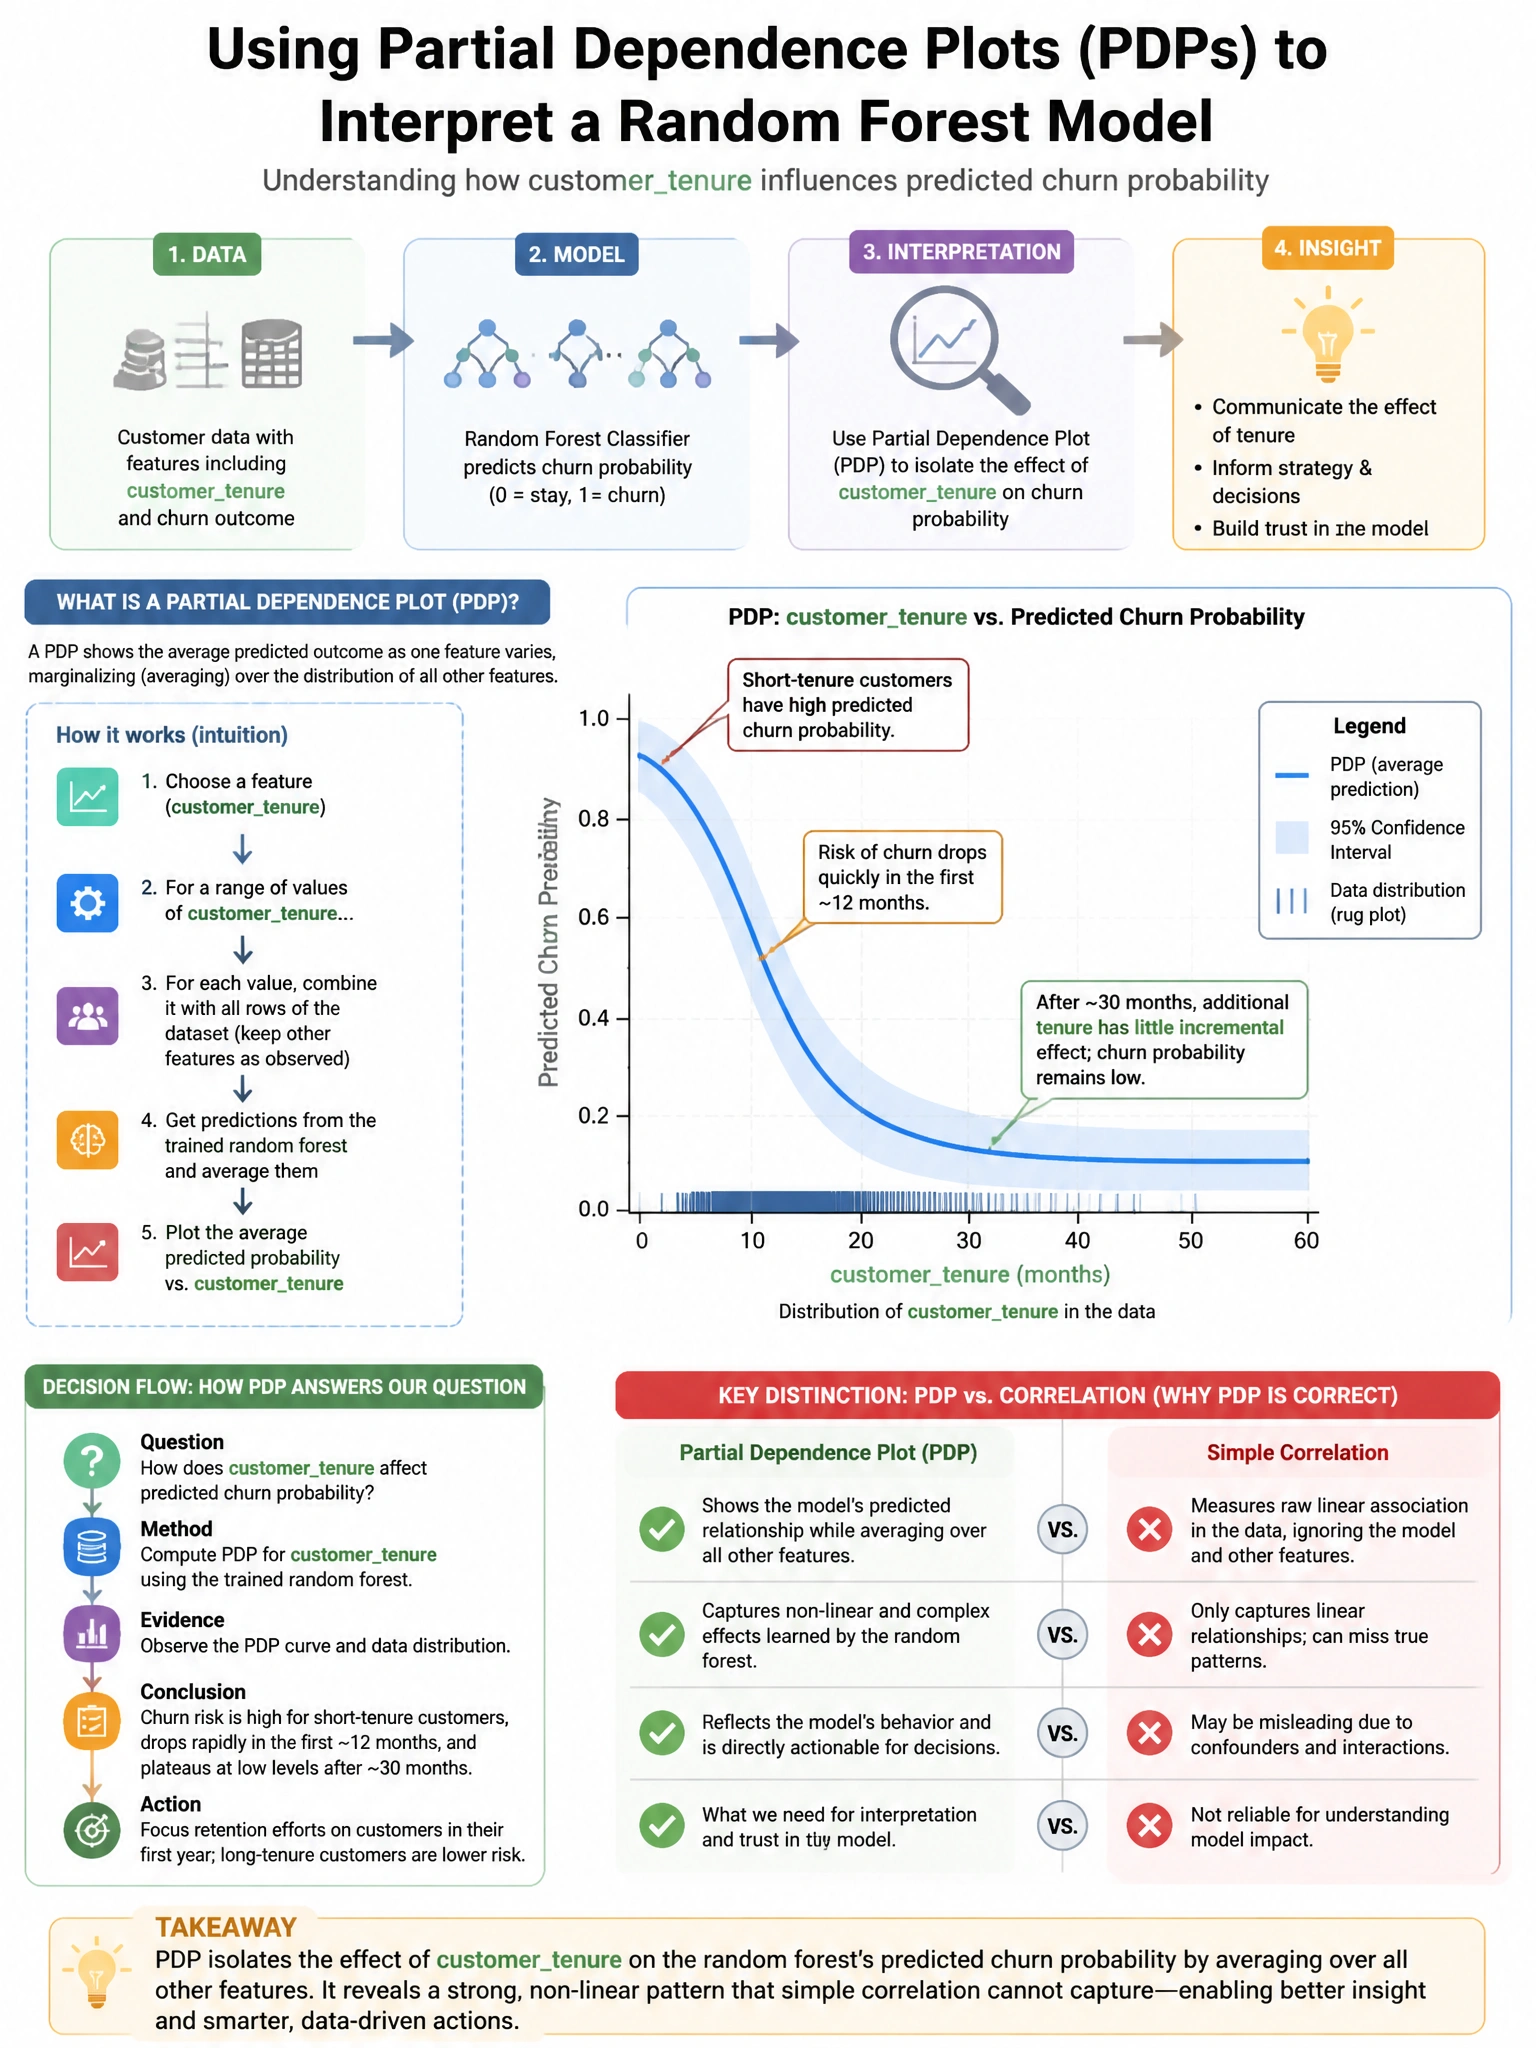
Full Explanation
B is correct because a PDP U-shape means the model's marginal effect of tenure on predicted churn probability has high values at both extremes (short tenure = new customers still deciding, long tenure = potentially bored/churning customers) with lower churn probability in the middle (satisfied, established customers). A is wrong; random forests can learn non-monotone effects. C is wrong; PDPs marginalize over other variables but are still useful for interpreting the average feature effect. D is wrong; a non-monotone shape can reflect a genuine and important non-linear relationship.