
A SAS PROC VARCLUS output shows that a cluster has R-squared with its own component = 0.45 but next-nearest cluster R-squared = 0.48. What does this imply?
Select an answer to reveal the explanation.
Short Explanation and Infographic
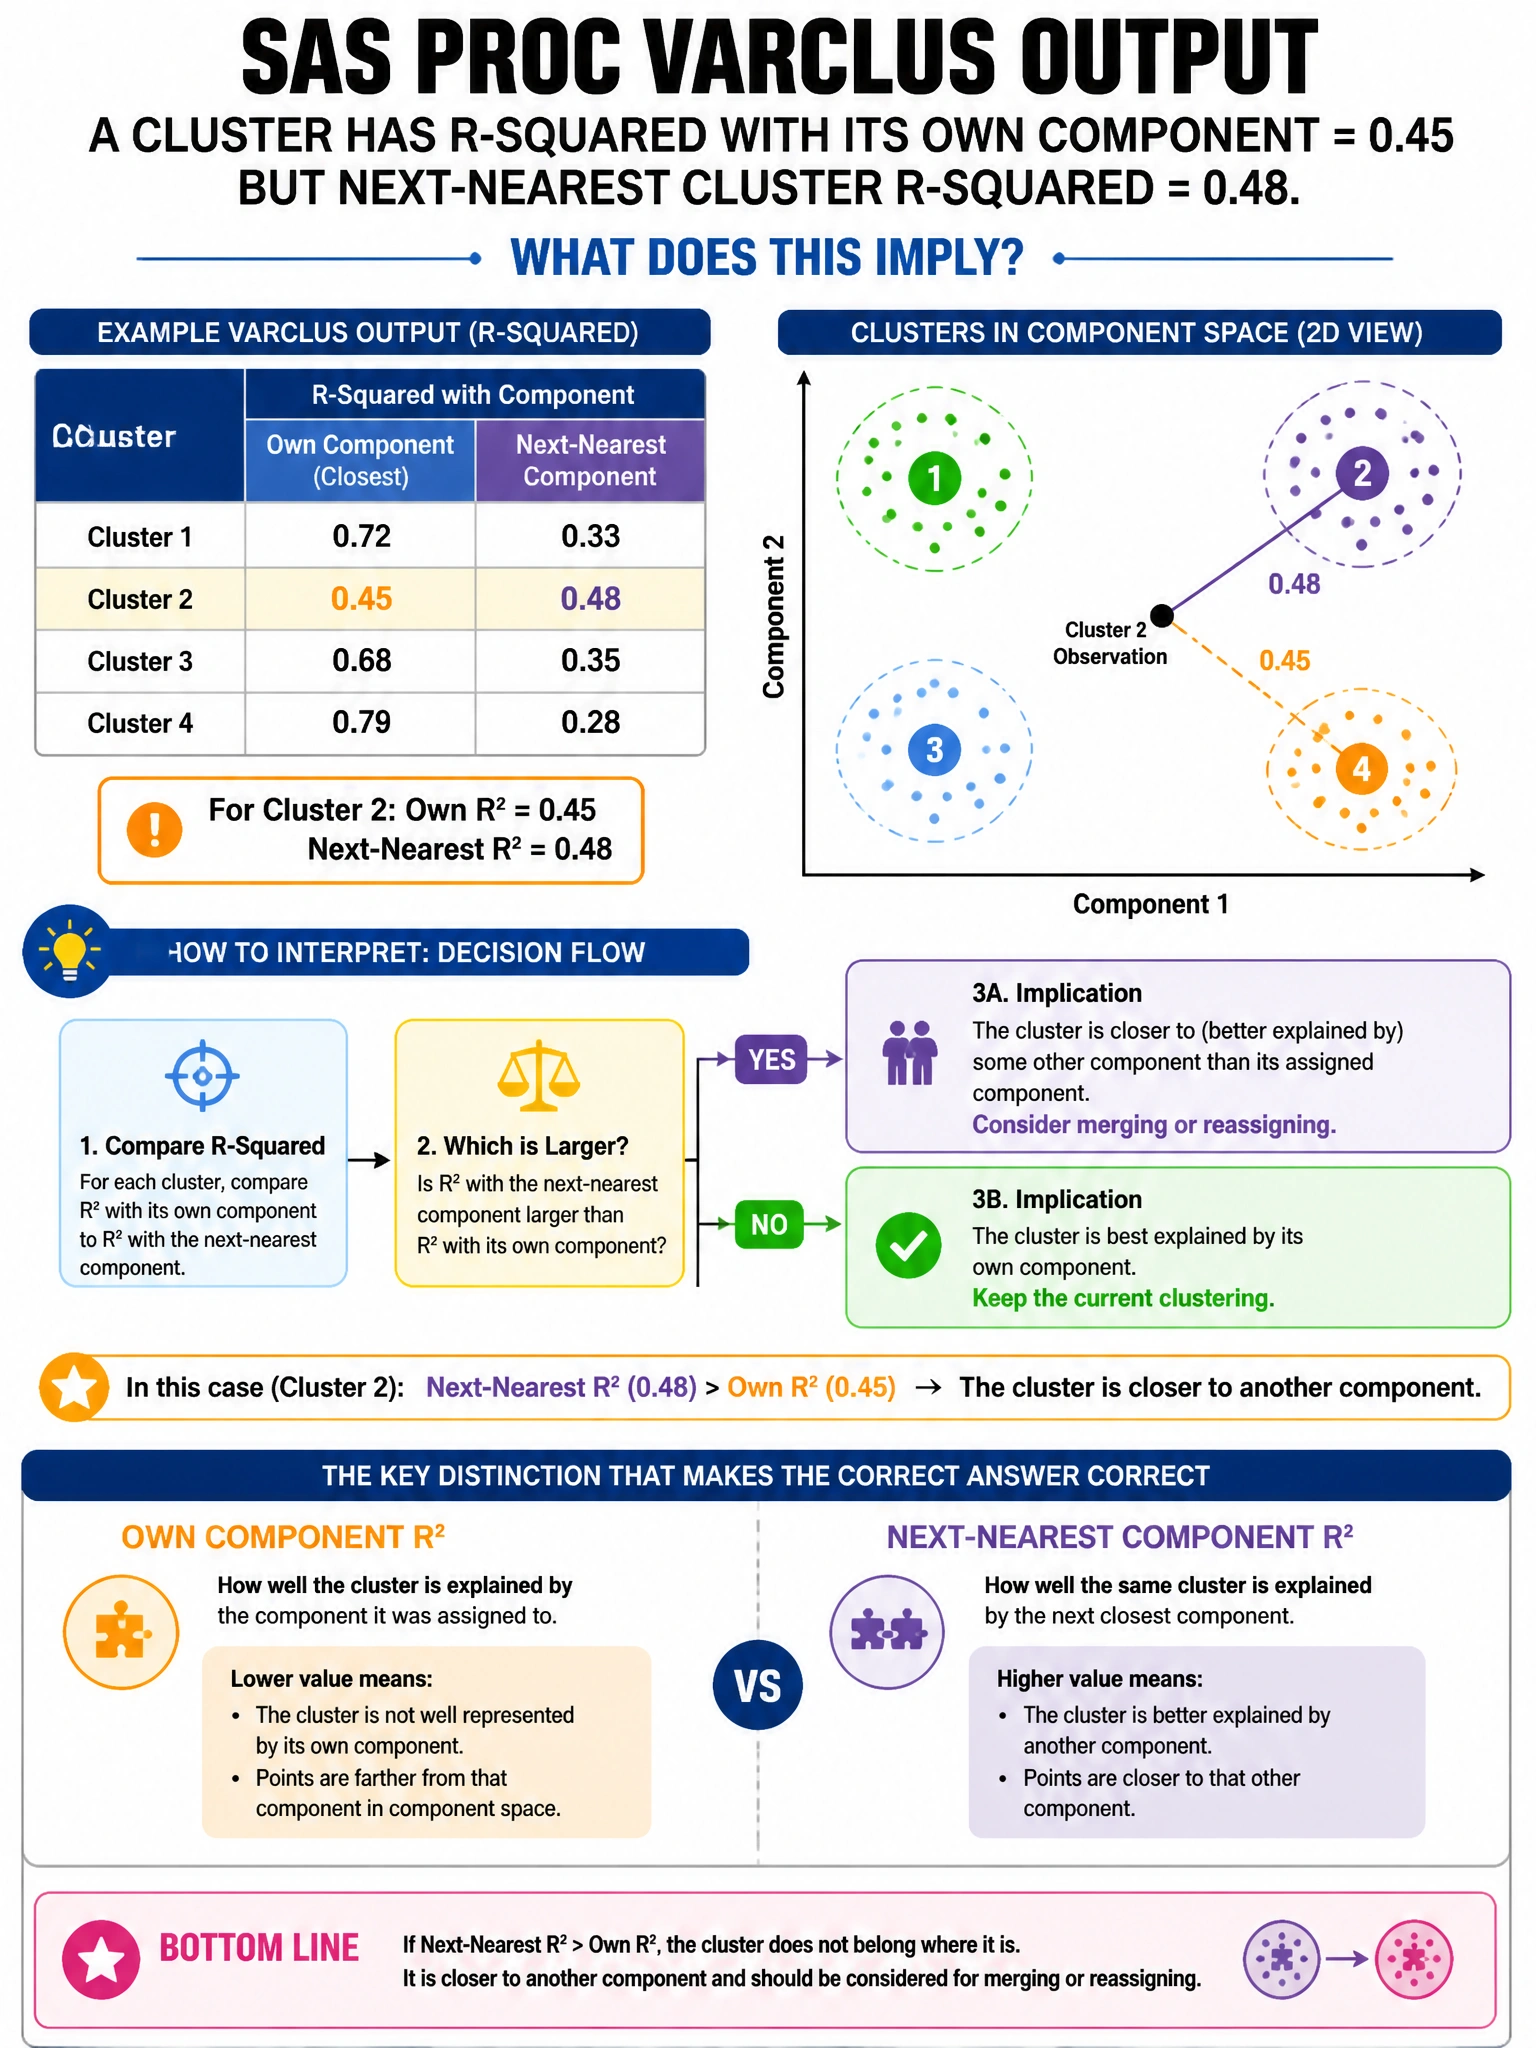
Here's the deal — b is correct because when a cluster's variables are better explained by another cluster's component (next R-squared 0.48 > own R-squared 0.45), the 1-R2 ratio > 1.0, signaling that the current cluster structure is suboptimal — variables may be misassigned. A is wrong; the low own R-squared (0.45) and higher next R-squared indicate poor cohesion.
Full explanation below image
Full Explanation
B is correct because when a cluster's variables are better explained by another cluster's component (next R-squared 0.48 > own R-squared 0.45), the 1-R2 ratio > 1.0, signaling that the current cluster structure is suboptimal — variables may be misassigned. A is wrong; the low own R-squared (0.45) and higher next R-squared indicate poor cohesion. C is wrong; adding variables does not fix the misassignment issue. D is wrong; single-variable clusters would have R-squared = 1.0 with their own component.