
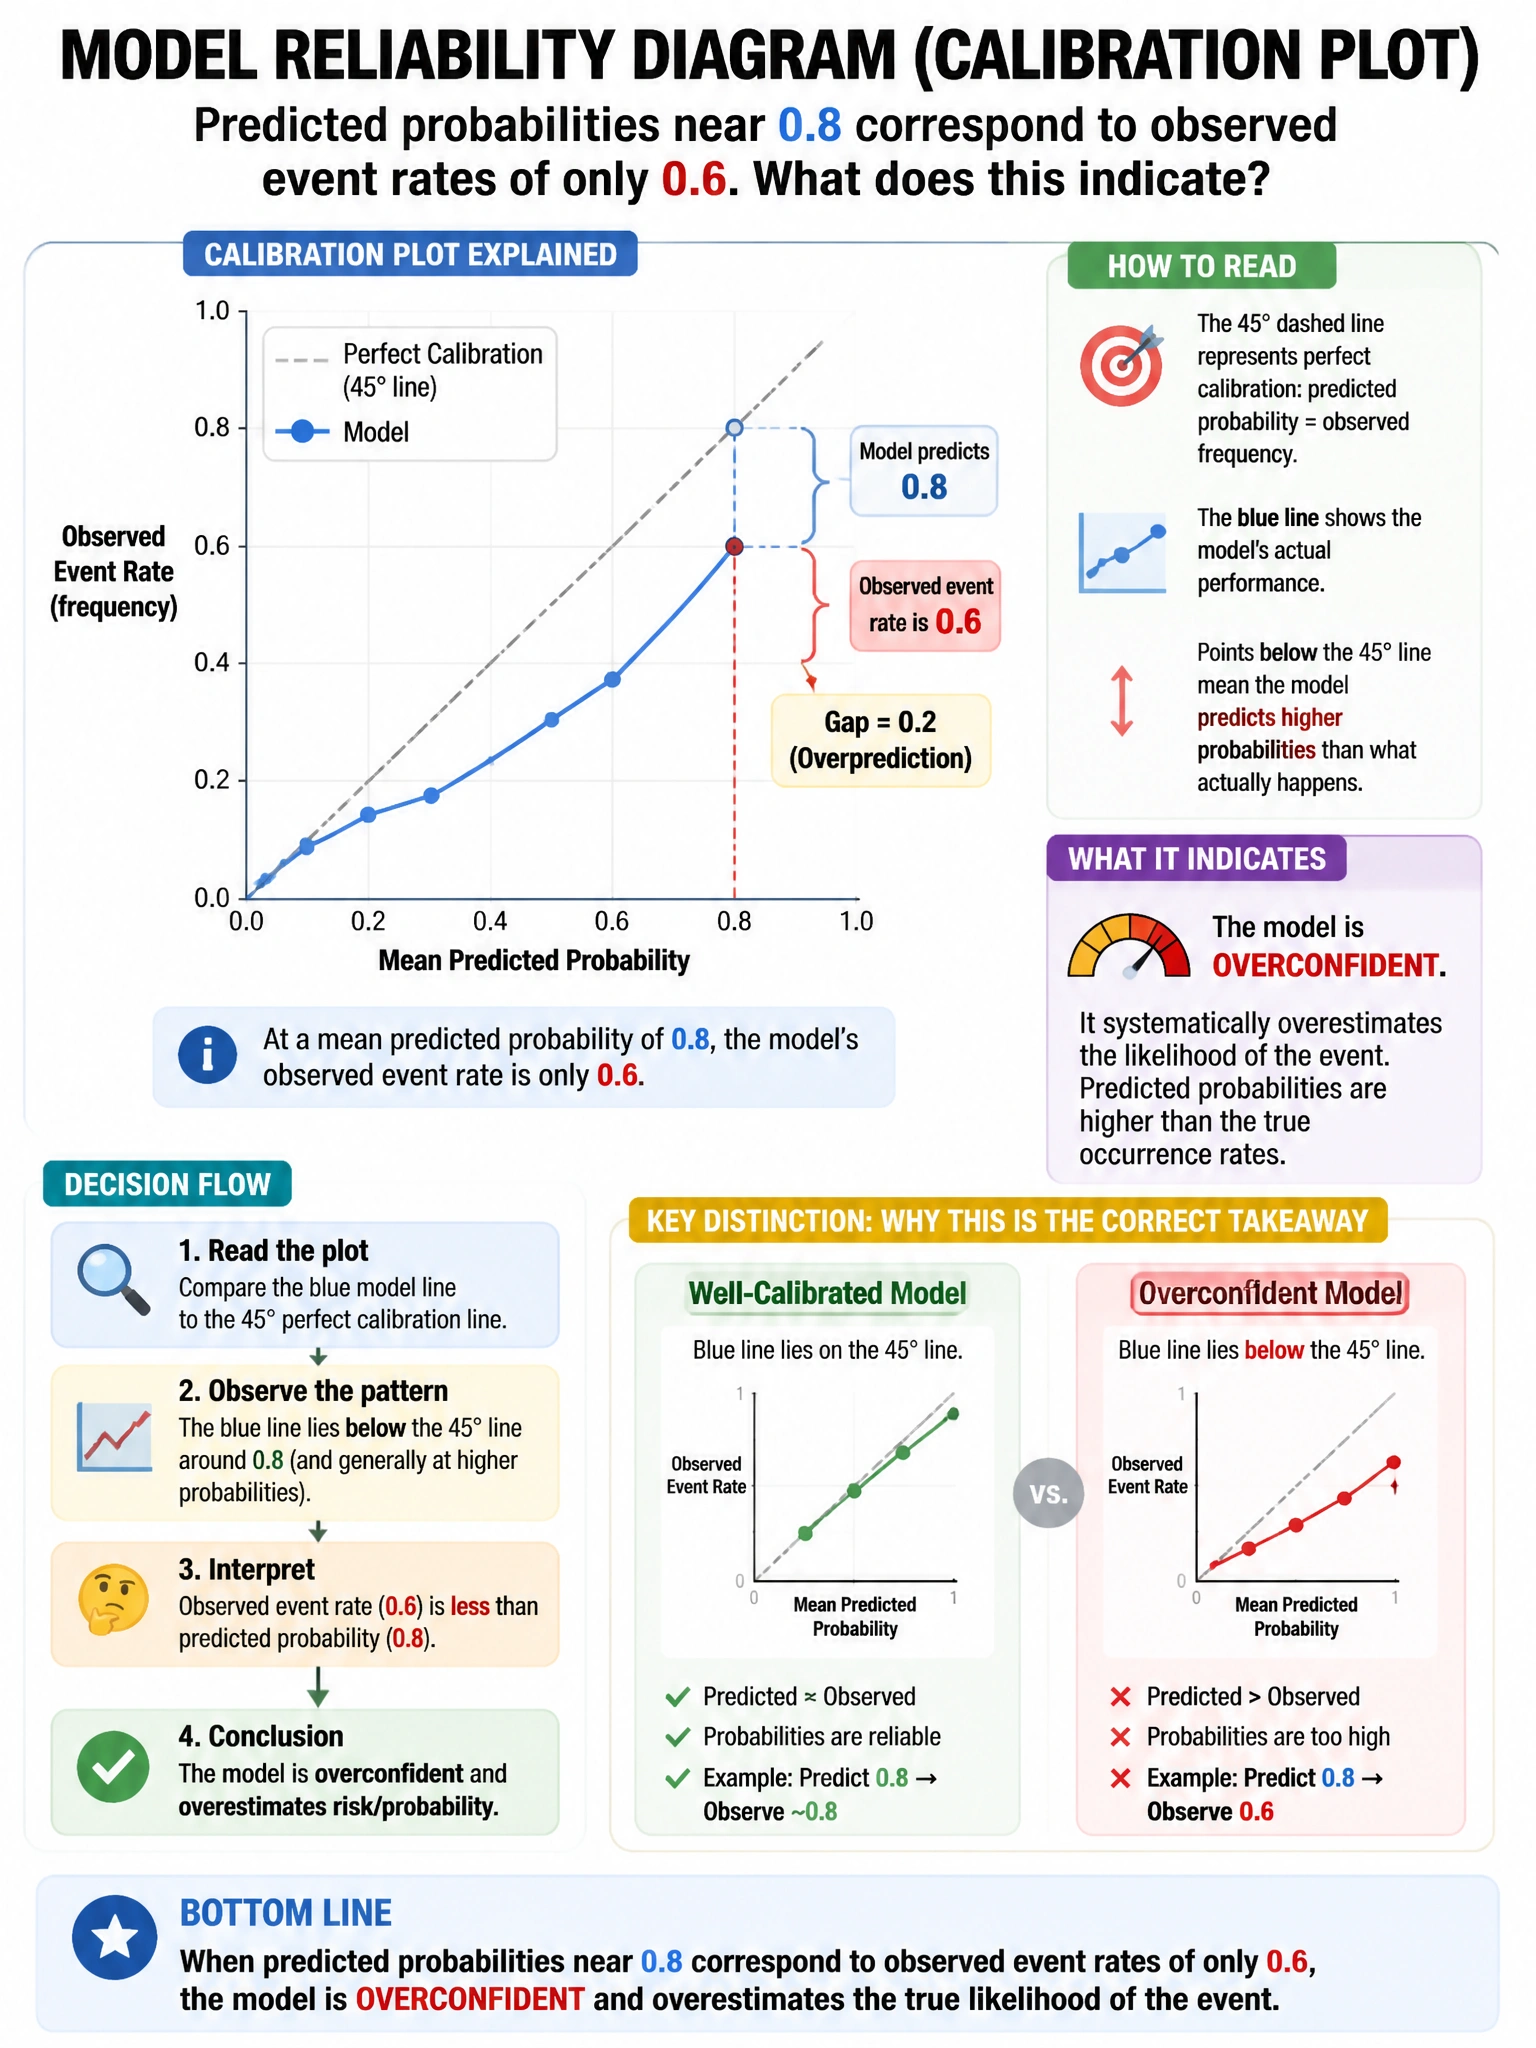
A model reliability diagram (calibration plot) shows that predicted probabilities near 0.8 correspond to observed event rates of only 0.6. What does this indicate about the model?
Select an answer to reveal the explanation.
Short Explanation and Infographic
Here's the deal — b is correct because when predicted probabilities (0.8) are systematically higher than observed rates (0.6), the model is overconfident — it assigns too high a probability to events that occur less frequently. C (underconfidence) would be the opposite: observed rate > predicted probability.
Full explanation below image
Full Explanation
B is correct because when predicted probabilities (0.8) are systematically higher than observed rates (0.6), the model is overconfident — it assigns too high a probability to events that occur less frequently. C (underconfidence) would be the opposite: observed rate > predicted probability. A is wrong because well-calibrated models have predicted = observed. D is wrong; discrimination and calibration are distinct properties.