
A model monitoring system in SAS detects that input variable 'credit_utilization' has a PSI (Population Stability Index) of 0.31 over the past month. How should the data scientist interpret this?
Select an answer to reveal the explanation.
Short Explanation and Infographic
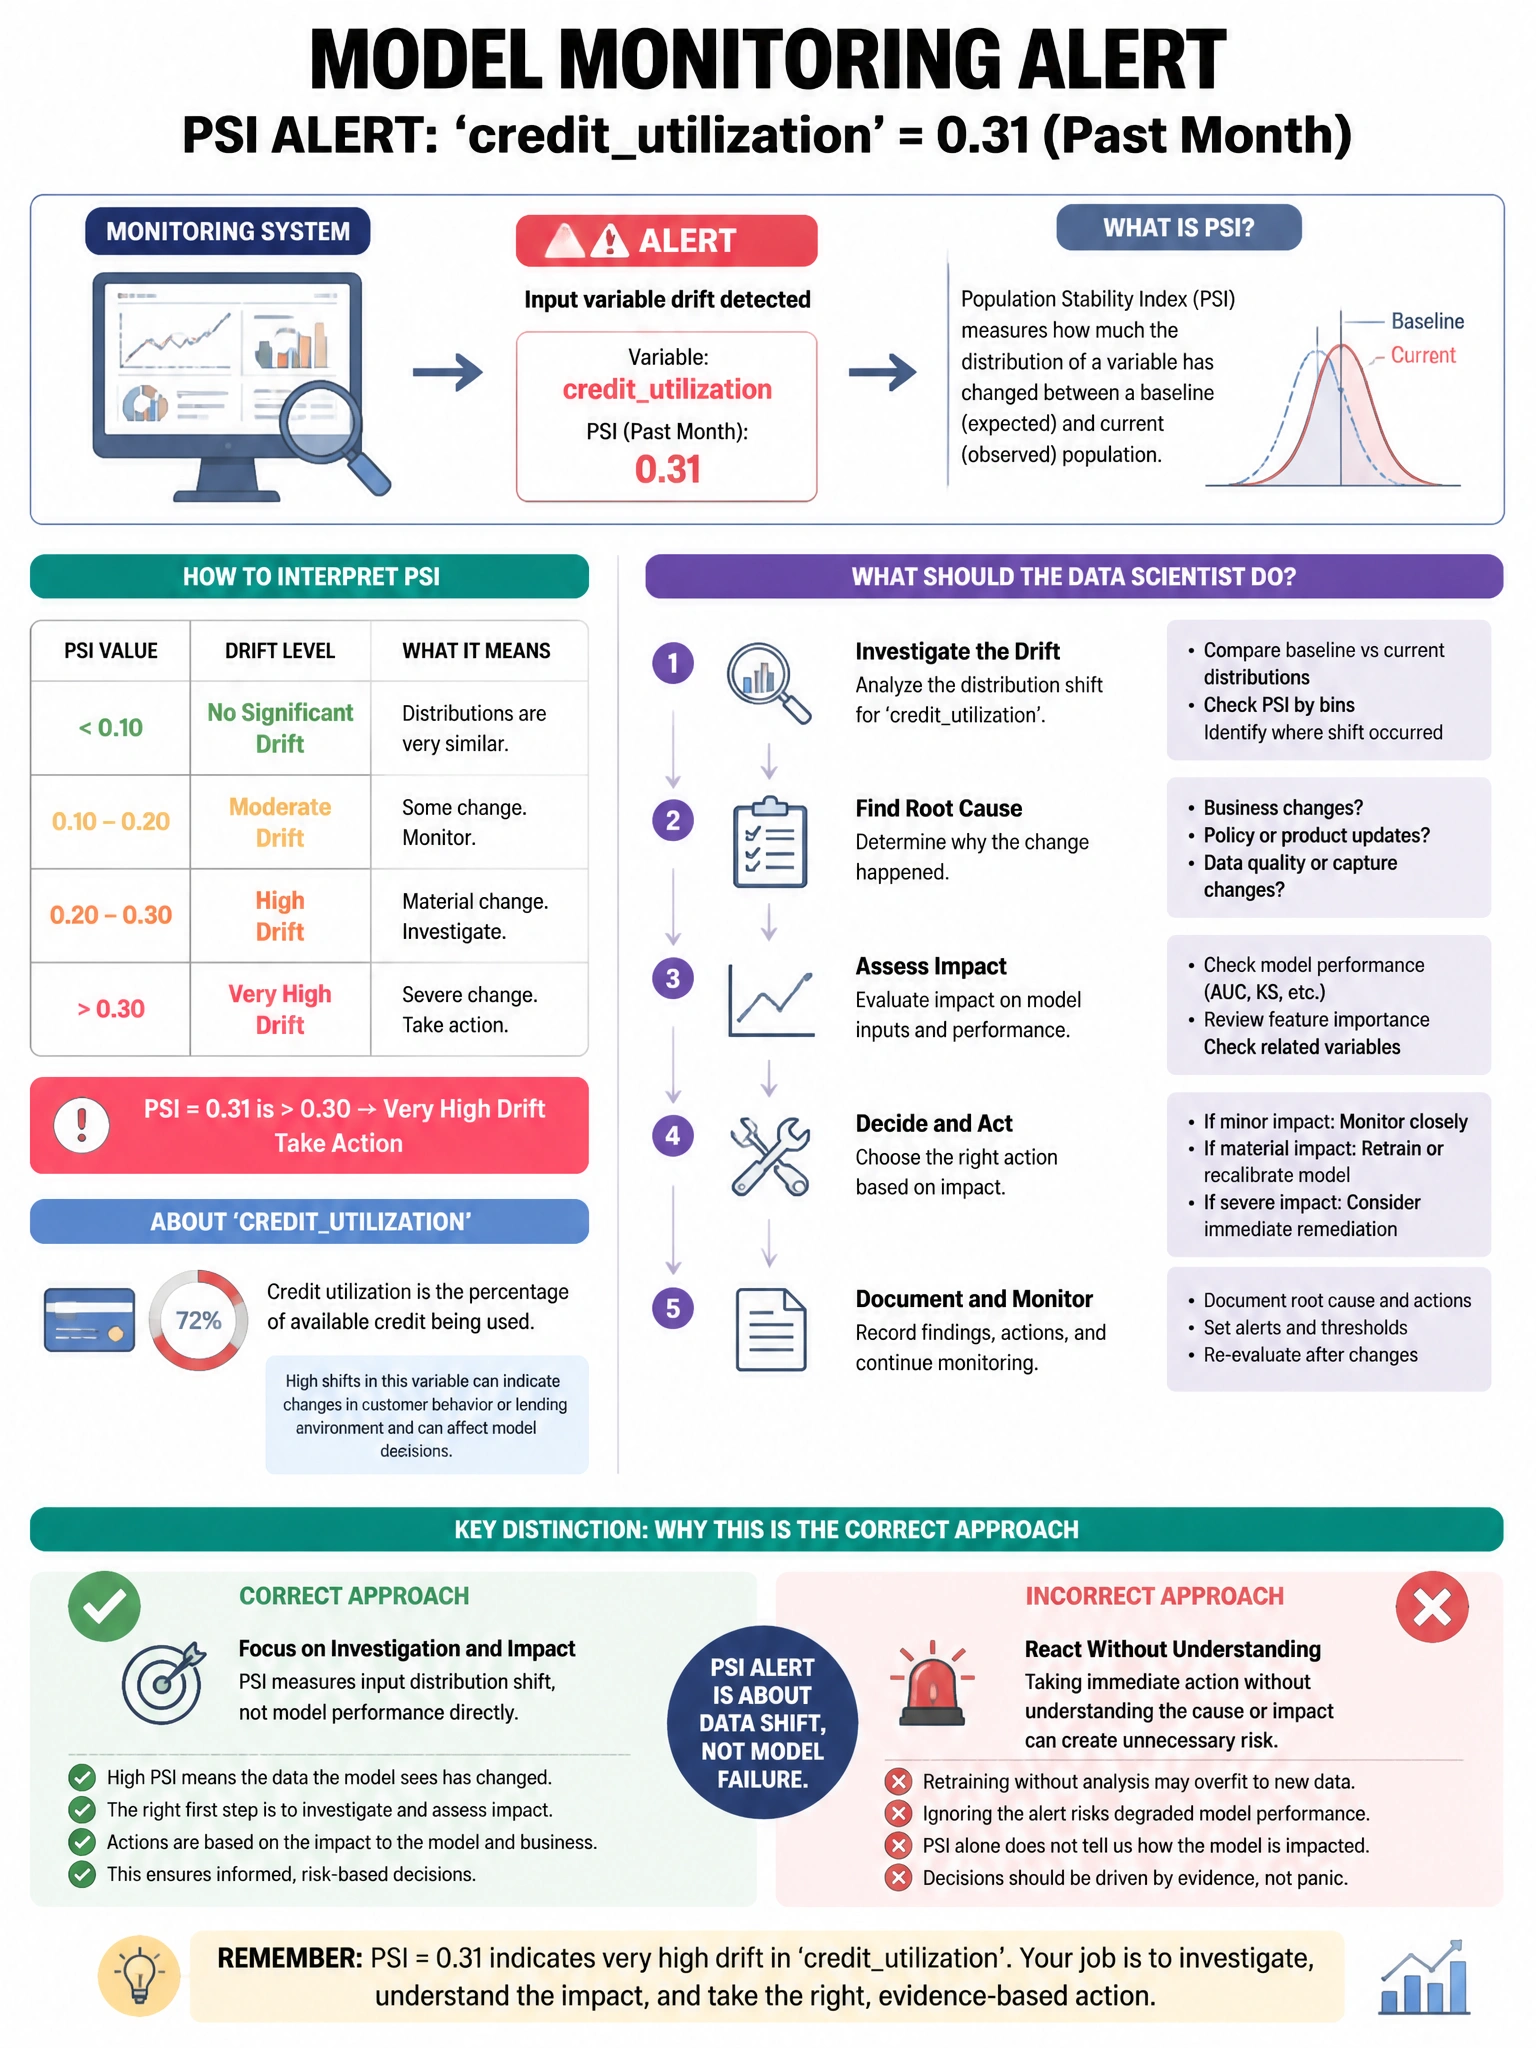
Here's the deal — c is correct because the standard PSI interpretation thresholds are: PSI < 0.10 = stable, 0.10-0.25 = moderate shift (monitor), PSI > 0.25 = significant shift (investigate/retrain). A PSI of 0.31 exceeds 0.25, indicating the credit_utilization distribution has shifted substantially from the training distribution, which may degrade model performance.
Full explanation below image
Full Explanation
C is correct because the standard PSI interpretation thresholds are: PSI < 0.10 = stable, 0.10-0.25 = moderate shift (monitor), PSI > 0.25 = significant shift (investigate/retrain). A PSI of 0.31 exceeds 0.25, indicating the credit_utilization distribution has shifted substantially from the training distribution, which may degrade model performance. A and B apply incorrect thresholds. D misinterprets PSI as a proportion of customers.