
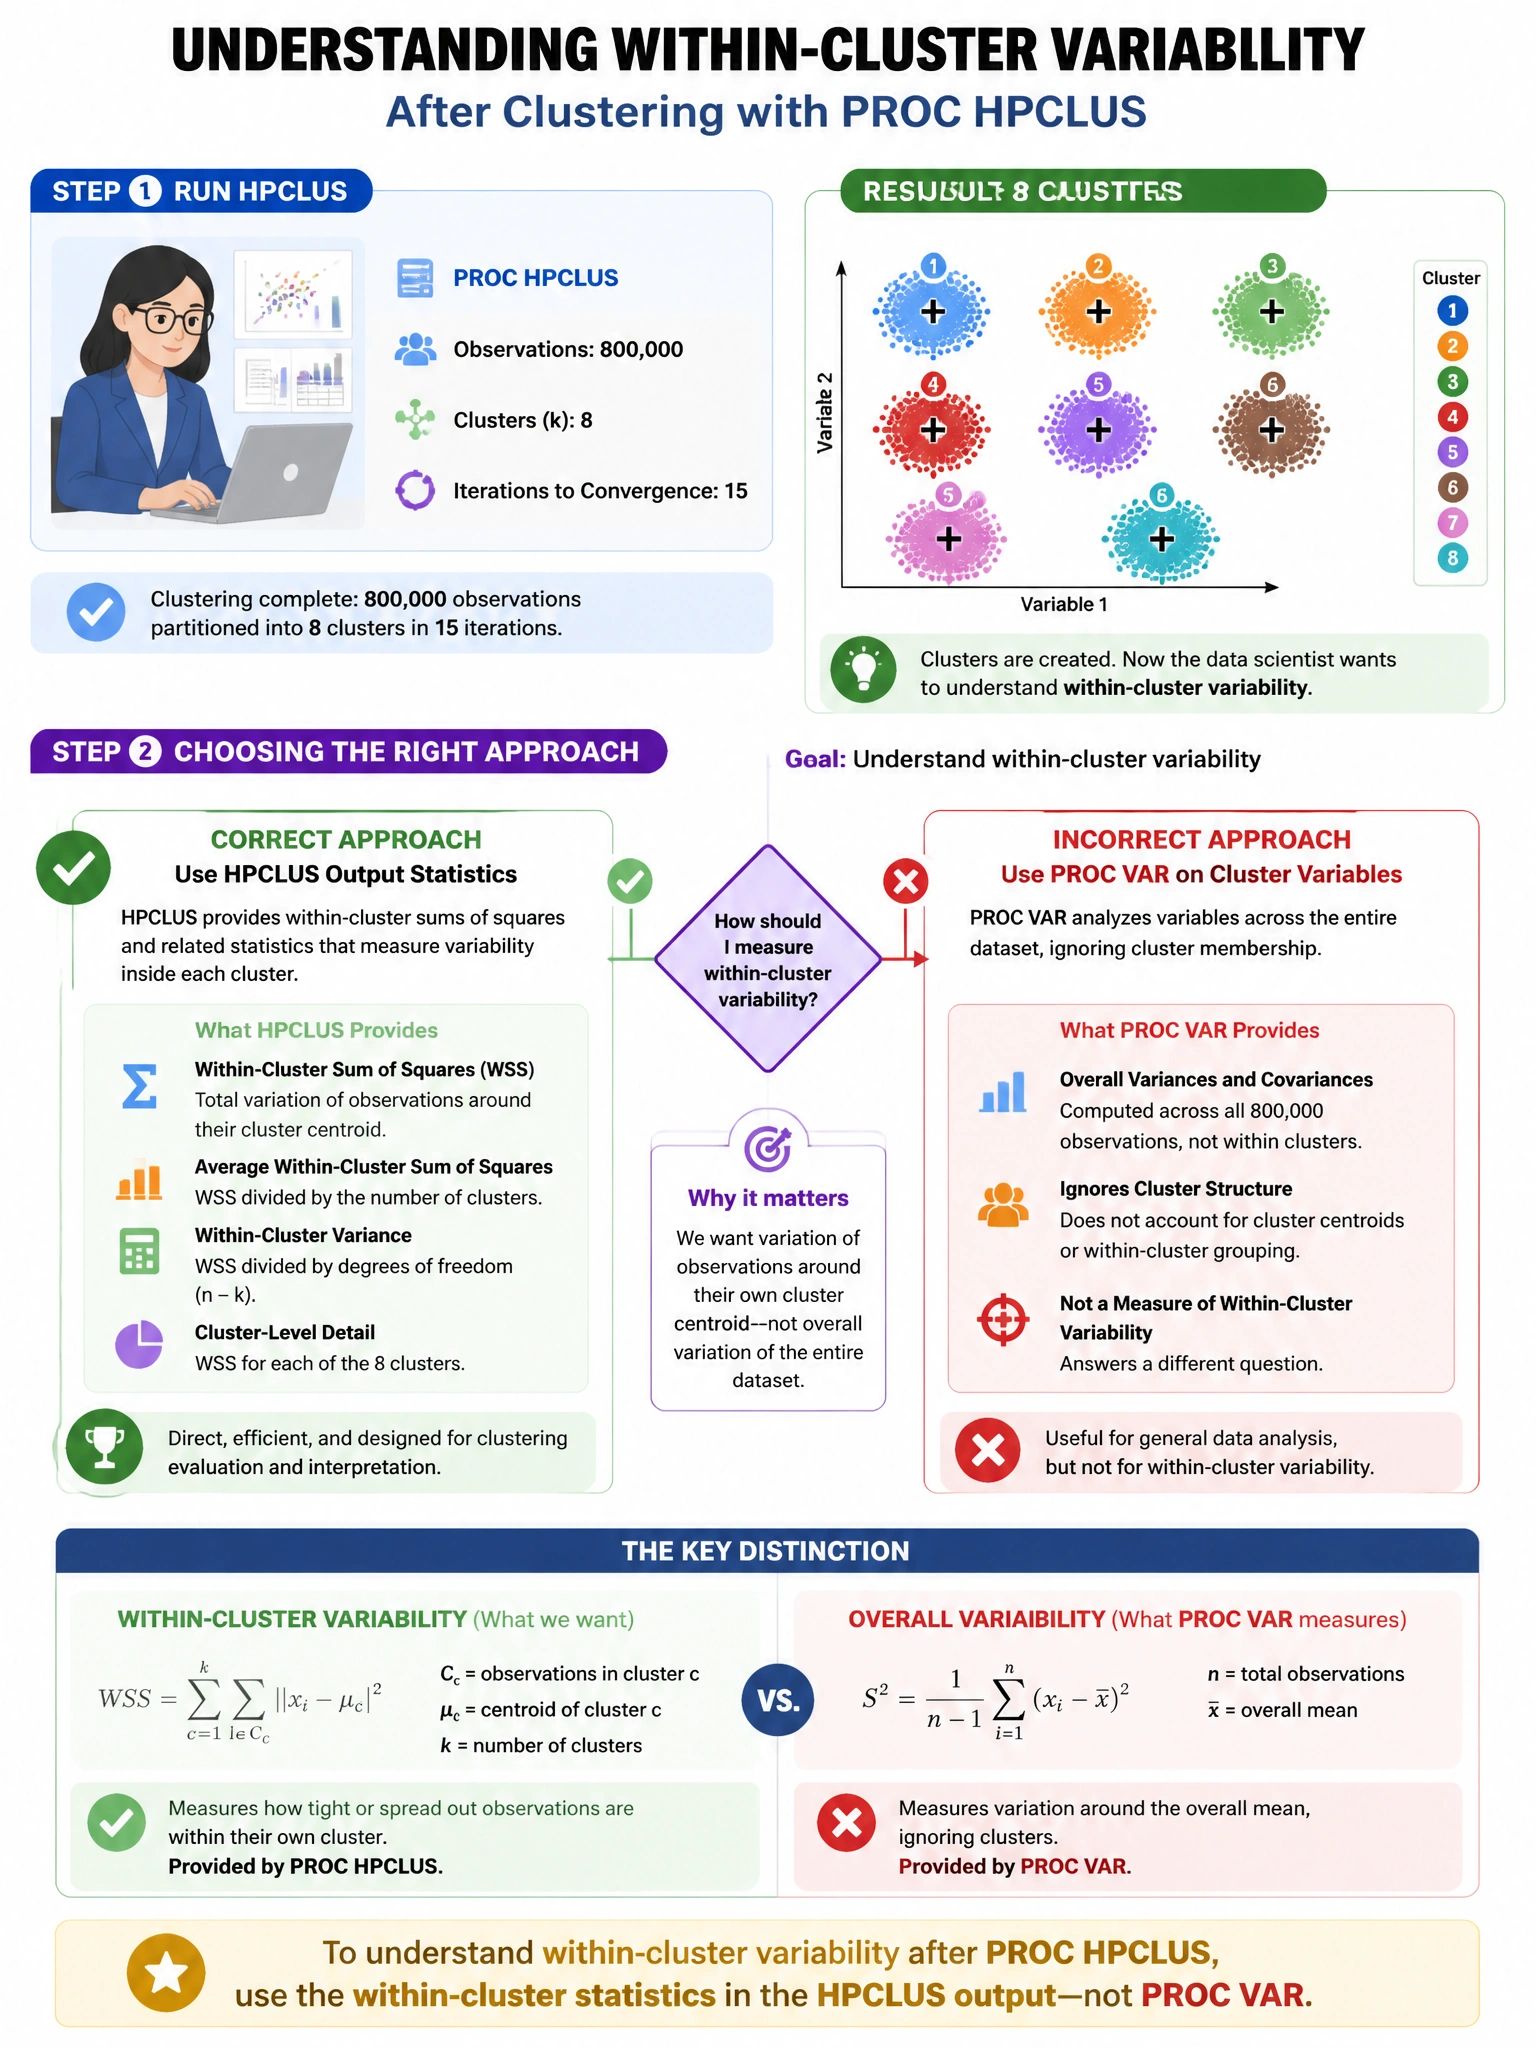
A data scientist applies PROC HPCLUS to 800,000 observations with k=8 clusters and converges in 15 iterations. The data scientist then wants to understand within-cluster variability. Which statistic output by PROC HPCLUS directly measures within-cluster variability?
Select an answer to reveal the explanation.
Short Explanation and Infographic
Here's the deal — b is correct because PROC HPCLUS reports the Root Mean Square Standard Deviation (RMSSTD) for each cluster, which measures the average within-cluster standard deviation across all variables — directly quantifying within-cluster compactness. A (BCSS) measures separation between clusters, not within-cluster variability.
Full explanation below image
Full Explanation
B is correct because PROC HPCLUS reports the Root Mean Square Standard Deviation (RMSSTD) for each cluster, which measures the average within-cluster standard deviation across all variables — directly quantifying within-cluster compactness. A (BCSS) measures separation between clusters, not within-cluster variability. C (Silhouette coefficient) is not a standard direct output of PROC HPCLUS. D (Cophenetic correlation) is a hierarchical clustering metric, not applicable to k-means.