
A data scientist applies PROC HPCLUS and obtains cluster centroids. They want to interpret which input variables drive the most separation between clusters. Which approach best identifies the most discriminating variables?
Select an answer to reveal the explanation.
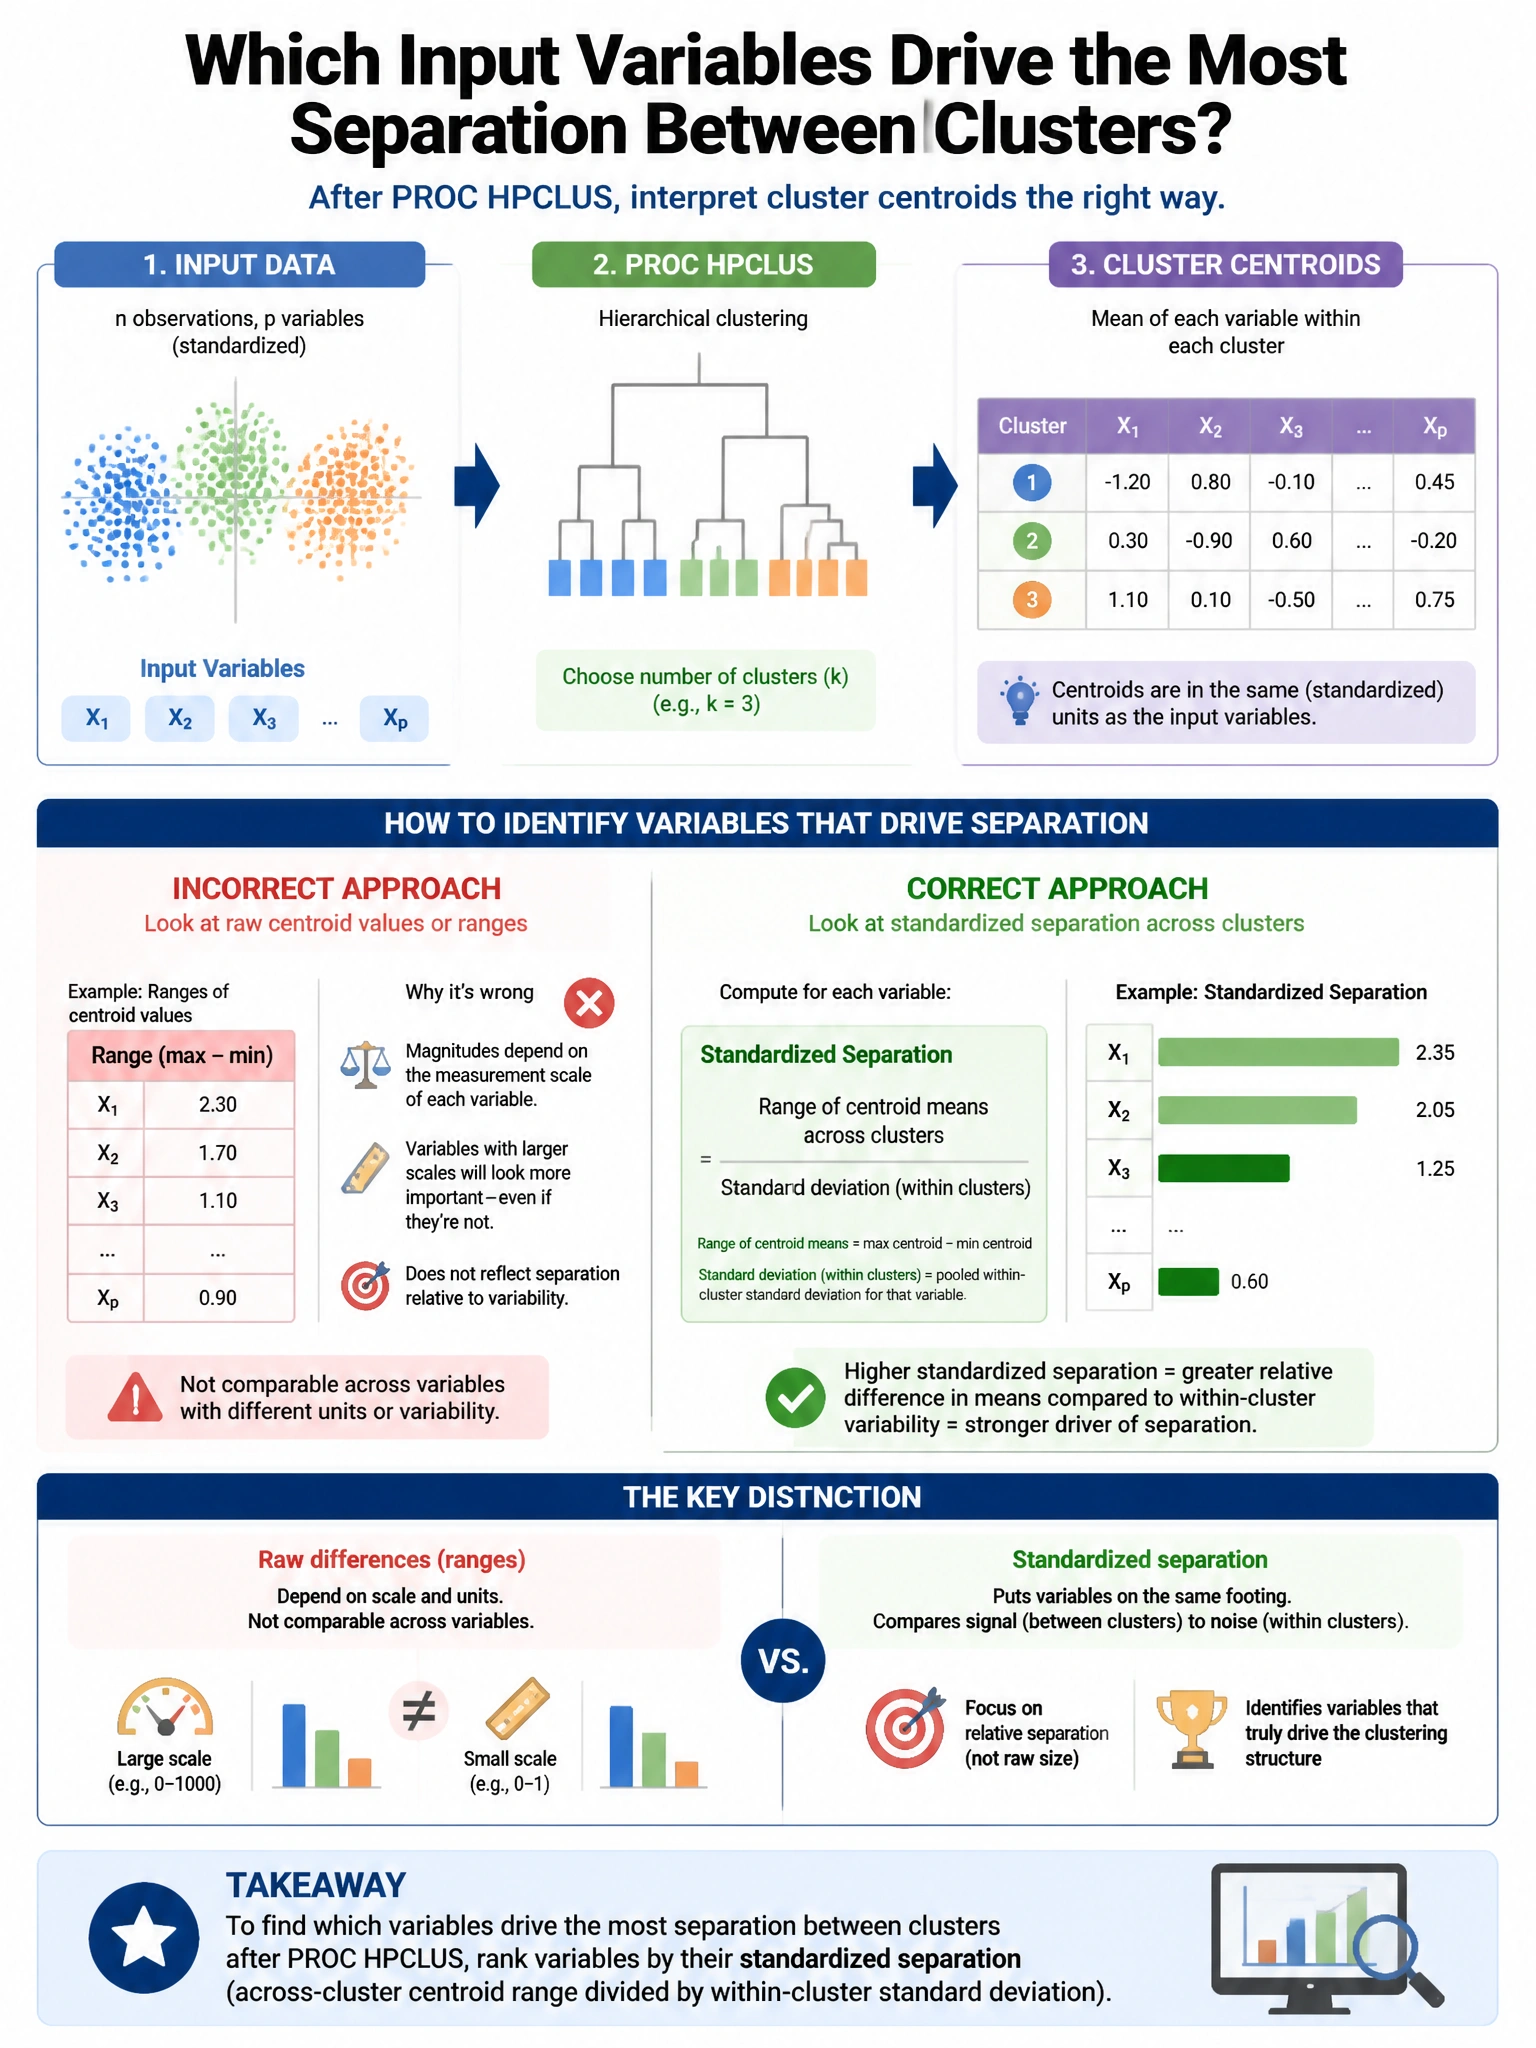
Short Explanation and Infographic
Here's the deal — a is correct because PROC DISCRIM's canonical discriminant analysis computes linear combinations of input variables that maximally separate the clusters (used as class groups), and the structure coefficients reveal which original variables contribute most to each discriminant dimension. B (correlation with cluster number) treats cluster labels as continuous ordinal values, which is inappropriate.
Full explanation below image
Full Explanation
A is correct because PROC DISCRIM's canonical discriminant analysis computes linear combinations of input variables that maximally separate the clusters (used as class groups), and the structure coefficients reveal which original variables contribute most to each discriminant dimension. B (correlation with cluster number) treats cluster labels as continuous ordinal values, which is inappropriate. C (leave-one-out HPCLUS) is computationally expensive and indirect. D (PROC HPLOGISTIC) is a valid alternative but is less interpretable for cluster profiling than canonical discriminant analysis.