
In SAS DLPy, a data scientist trains a CNN model and wants to visualize which regions of an input image most influenced the model's prediction. Which technique is commonly applied for this purpose?
Select an answer to reveal the explanation.
Short Explanation and Infographic
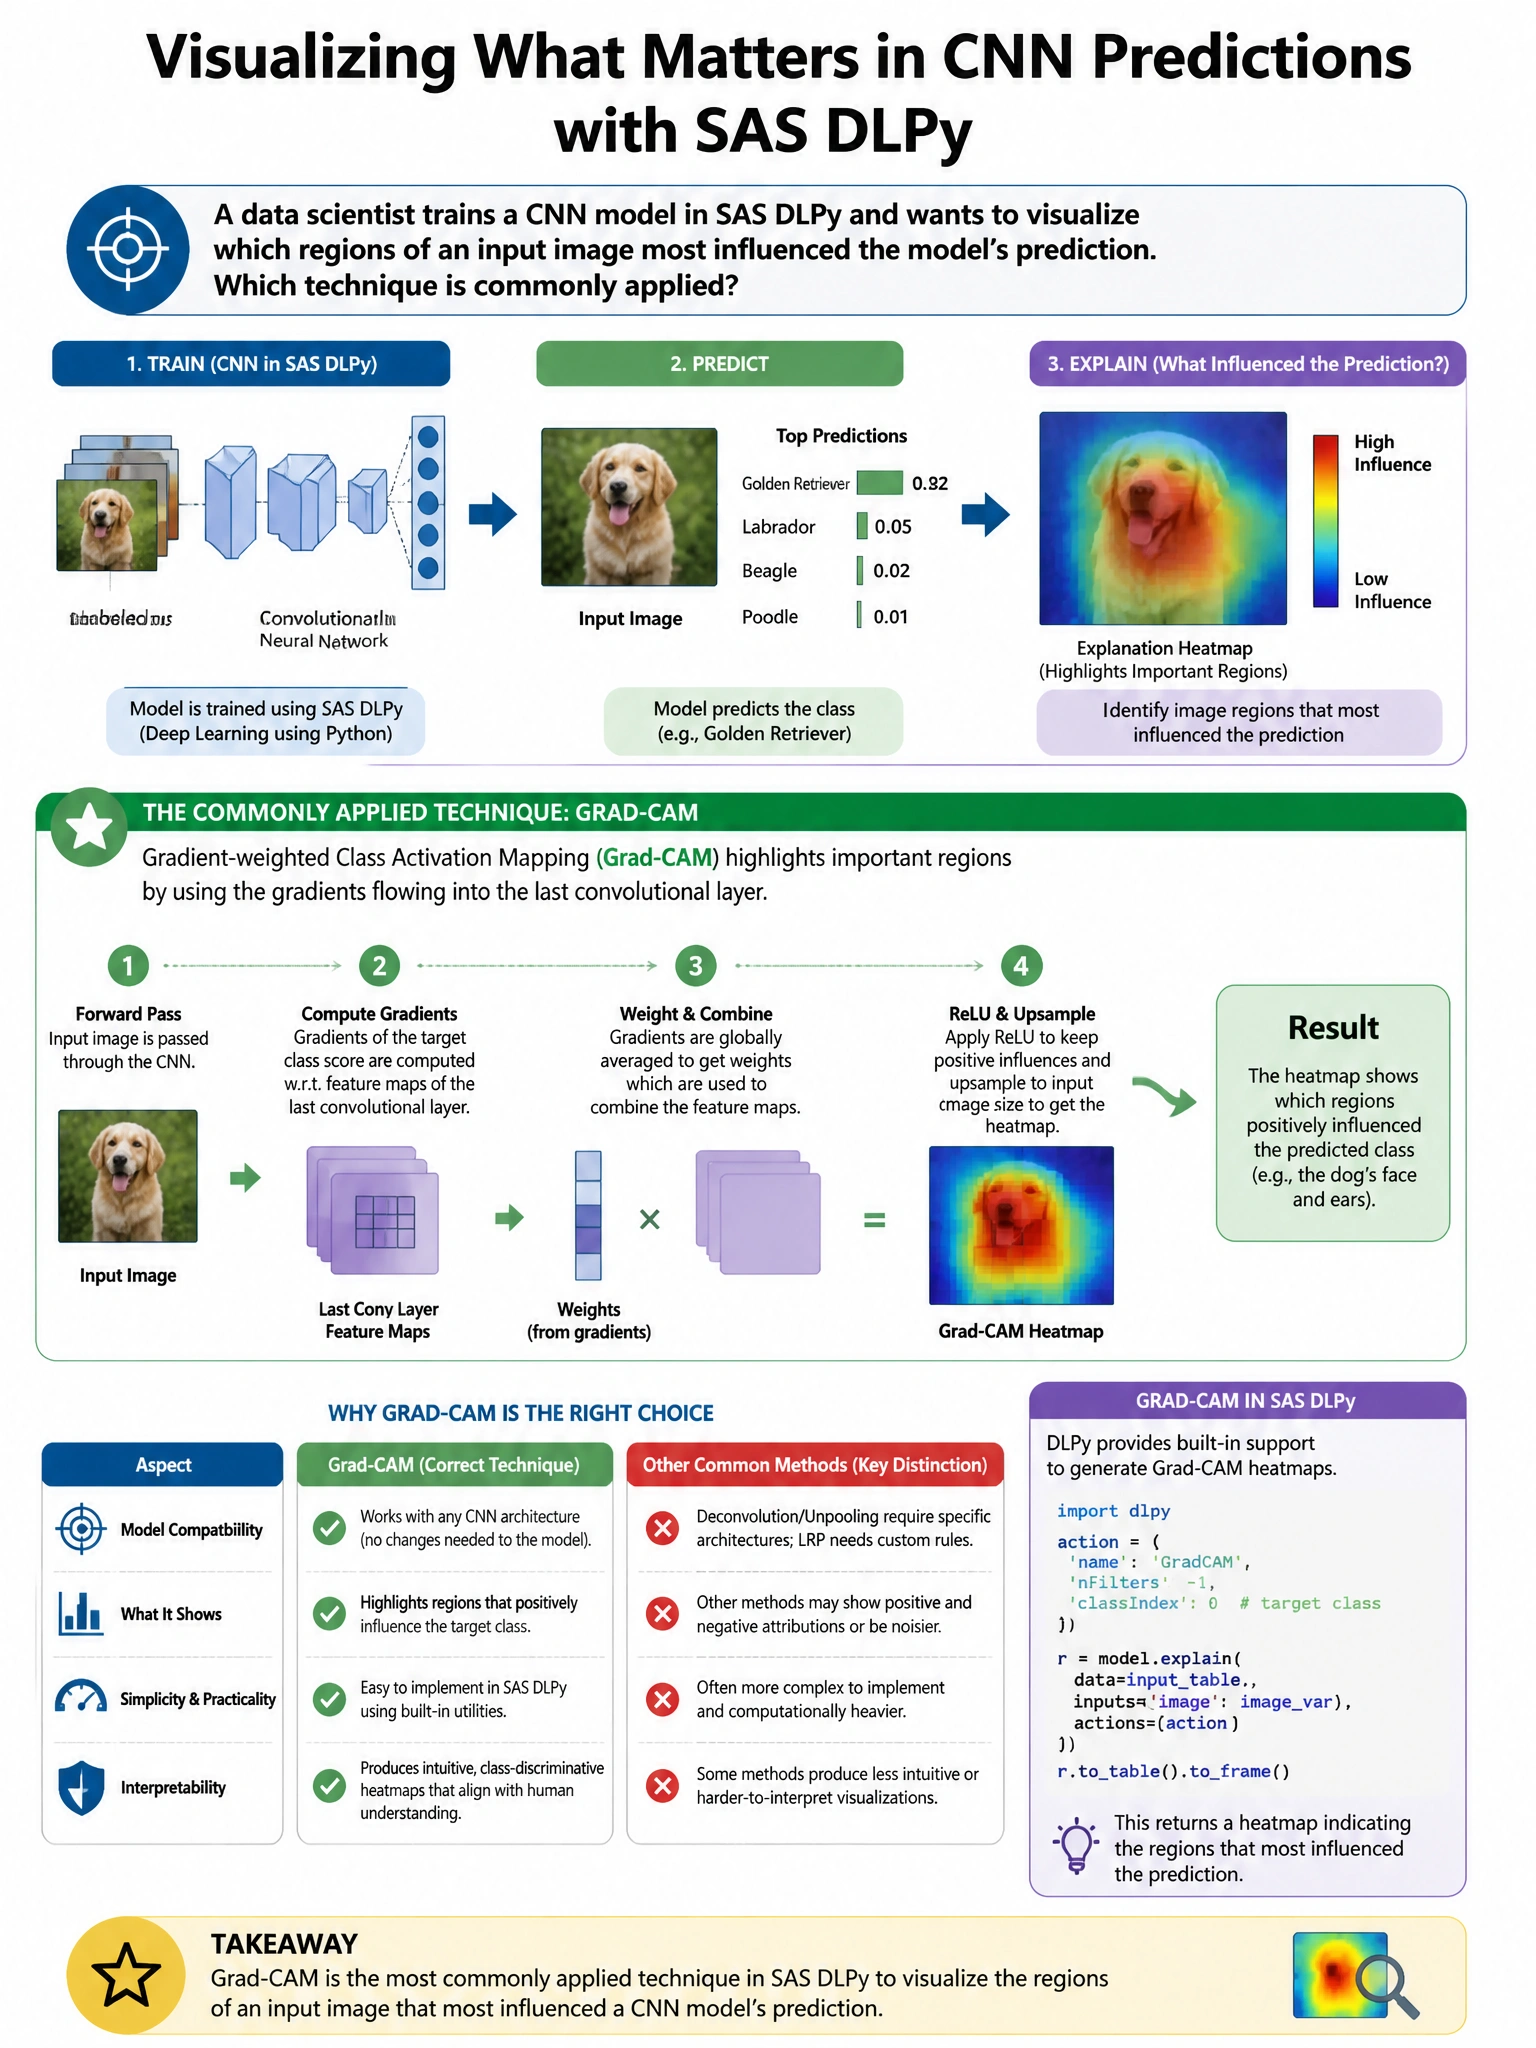
Here's the deal — b is correct because Class Activation Mapping (CAM) and Grad-CAM generate heatmaps showing which spatial regions of the input image contributed most to a specific class prediction by computing the gradient of the class score with respect to the final convolutional feature maps. SAS DLPy supports activation map visualization.
Full explanation below image
Full Explanation
B is correct because Class Activation Mapping (CAM) and Grad-CAM generate heatmaps showing which spatial regions of the input image contributed most to a specific class prediction by computing the gradient of the class score with respect to the final convolutional feature maps. SAS DLPy supports activation map visualization. A (PCA projection) is a dimensionality reduction technique, not a saliency method. C (t-SNE) visualizes latent space distributions, not input image relevance. D (PROC FACTOR rotation) operates on statistical variables, not neural network visualizations.