
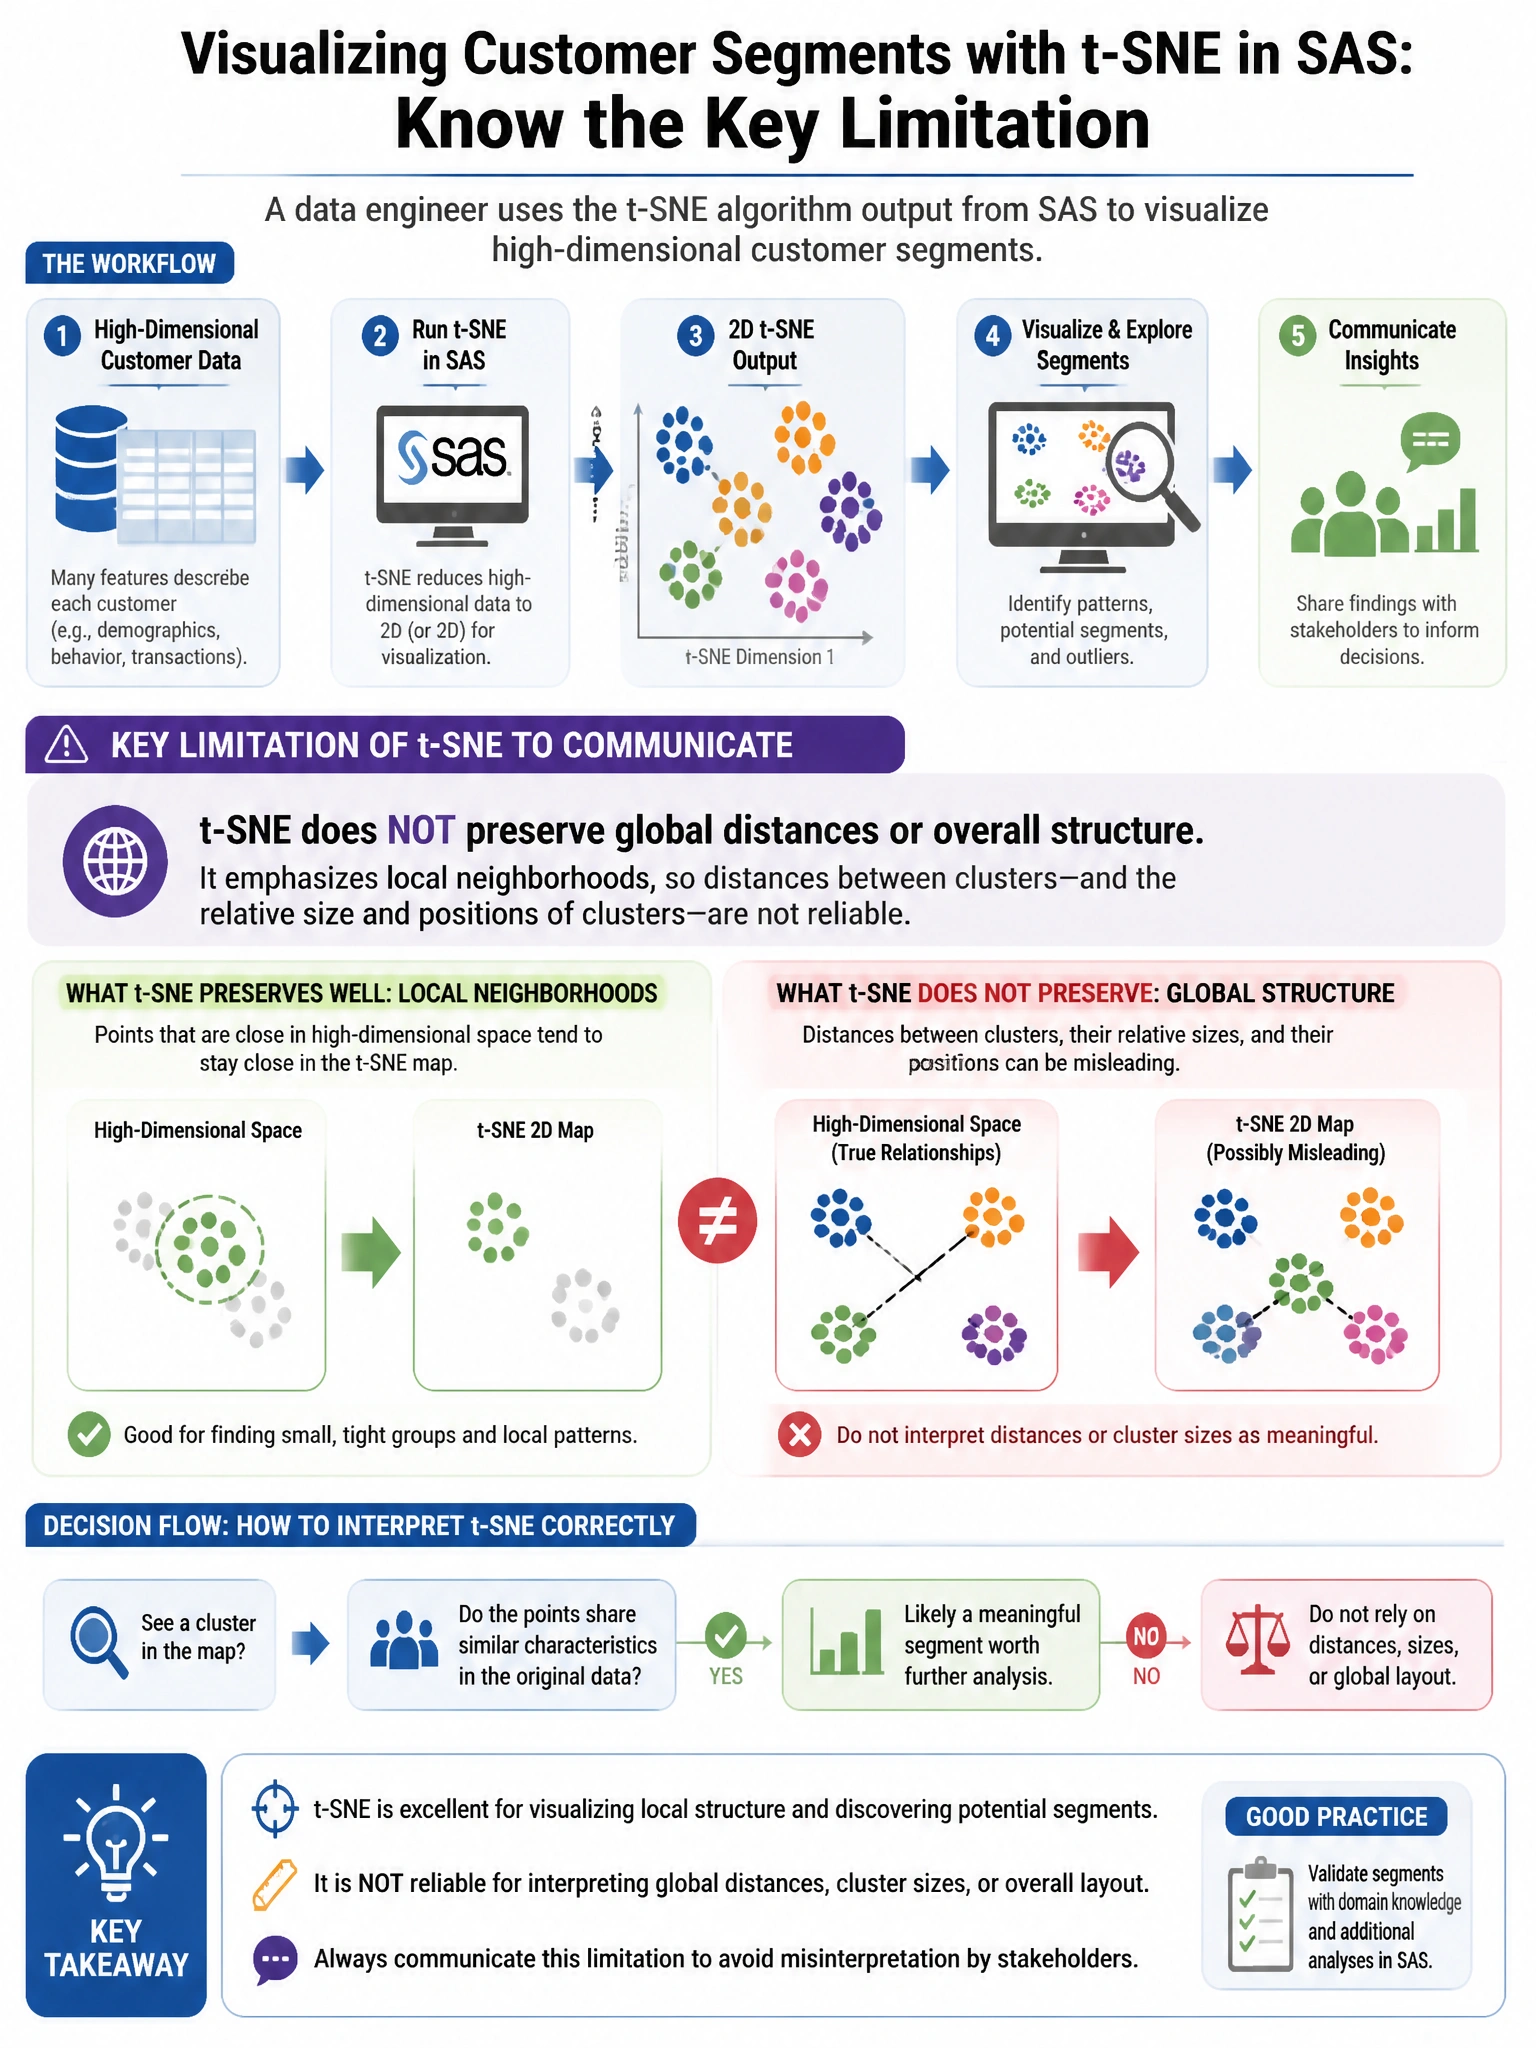
A data engineer uses the t-SNE algorithm output from SAS to visualize high-dimensional customer segments. What is a key limitation of t-SNE that the engineer should communicate to stakeholders?
Select an answer to reveal the explanation.
Short Explanation and Infographic
Here's the deal — c is correct because t-SNE prioritizes preserving local neighborhood structure and is not designed to preserve global distances between clusters. The relative positions of clusters in a t-SNE plot can be misleading.
Full explanation below image
Full Explanation
C is correct because t-SNE prioritizes preserving local neighborhood structure and is not designed to preserve global distances between clusters. The relative positions of clusters in a t-SNE plot can be misleading. It is also O(n^2) in computational cost, making it slow for large datasets. A is wrong — t-SNE does NOT preserve global distances (that's the limitation). B is wrong because t-SNE is stochastic and different random seeds produce different layouts. D is wrong because t-SNE is a dimensionality reduction technique, not a clustering algorithm requiring k.