
Department heads need interactive visual dashboards of curated budget-spend datasets already prepared in the analytics environment. Which AWS service best provides that business-intelligence visualization layer?
Select an answer to reveal the explanation.
Short Explanation
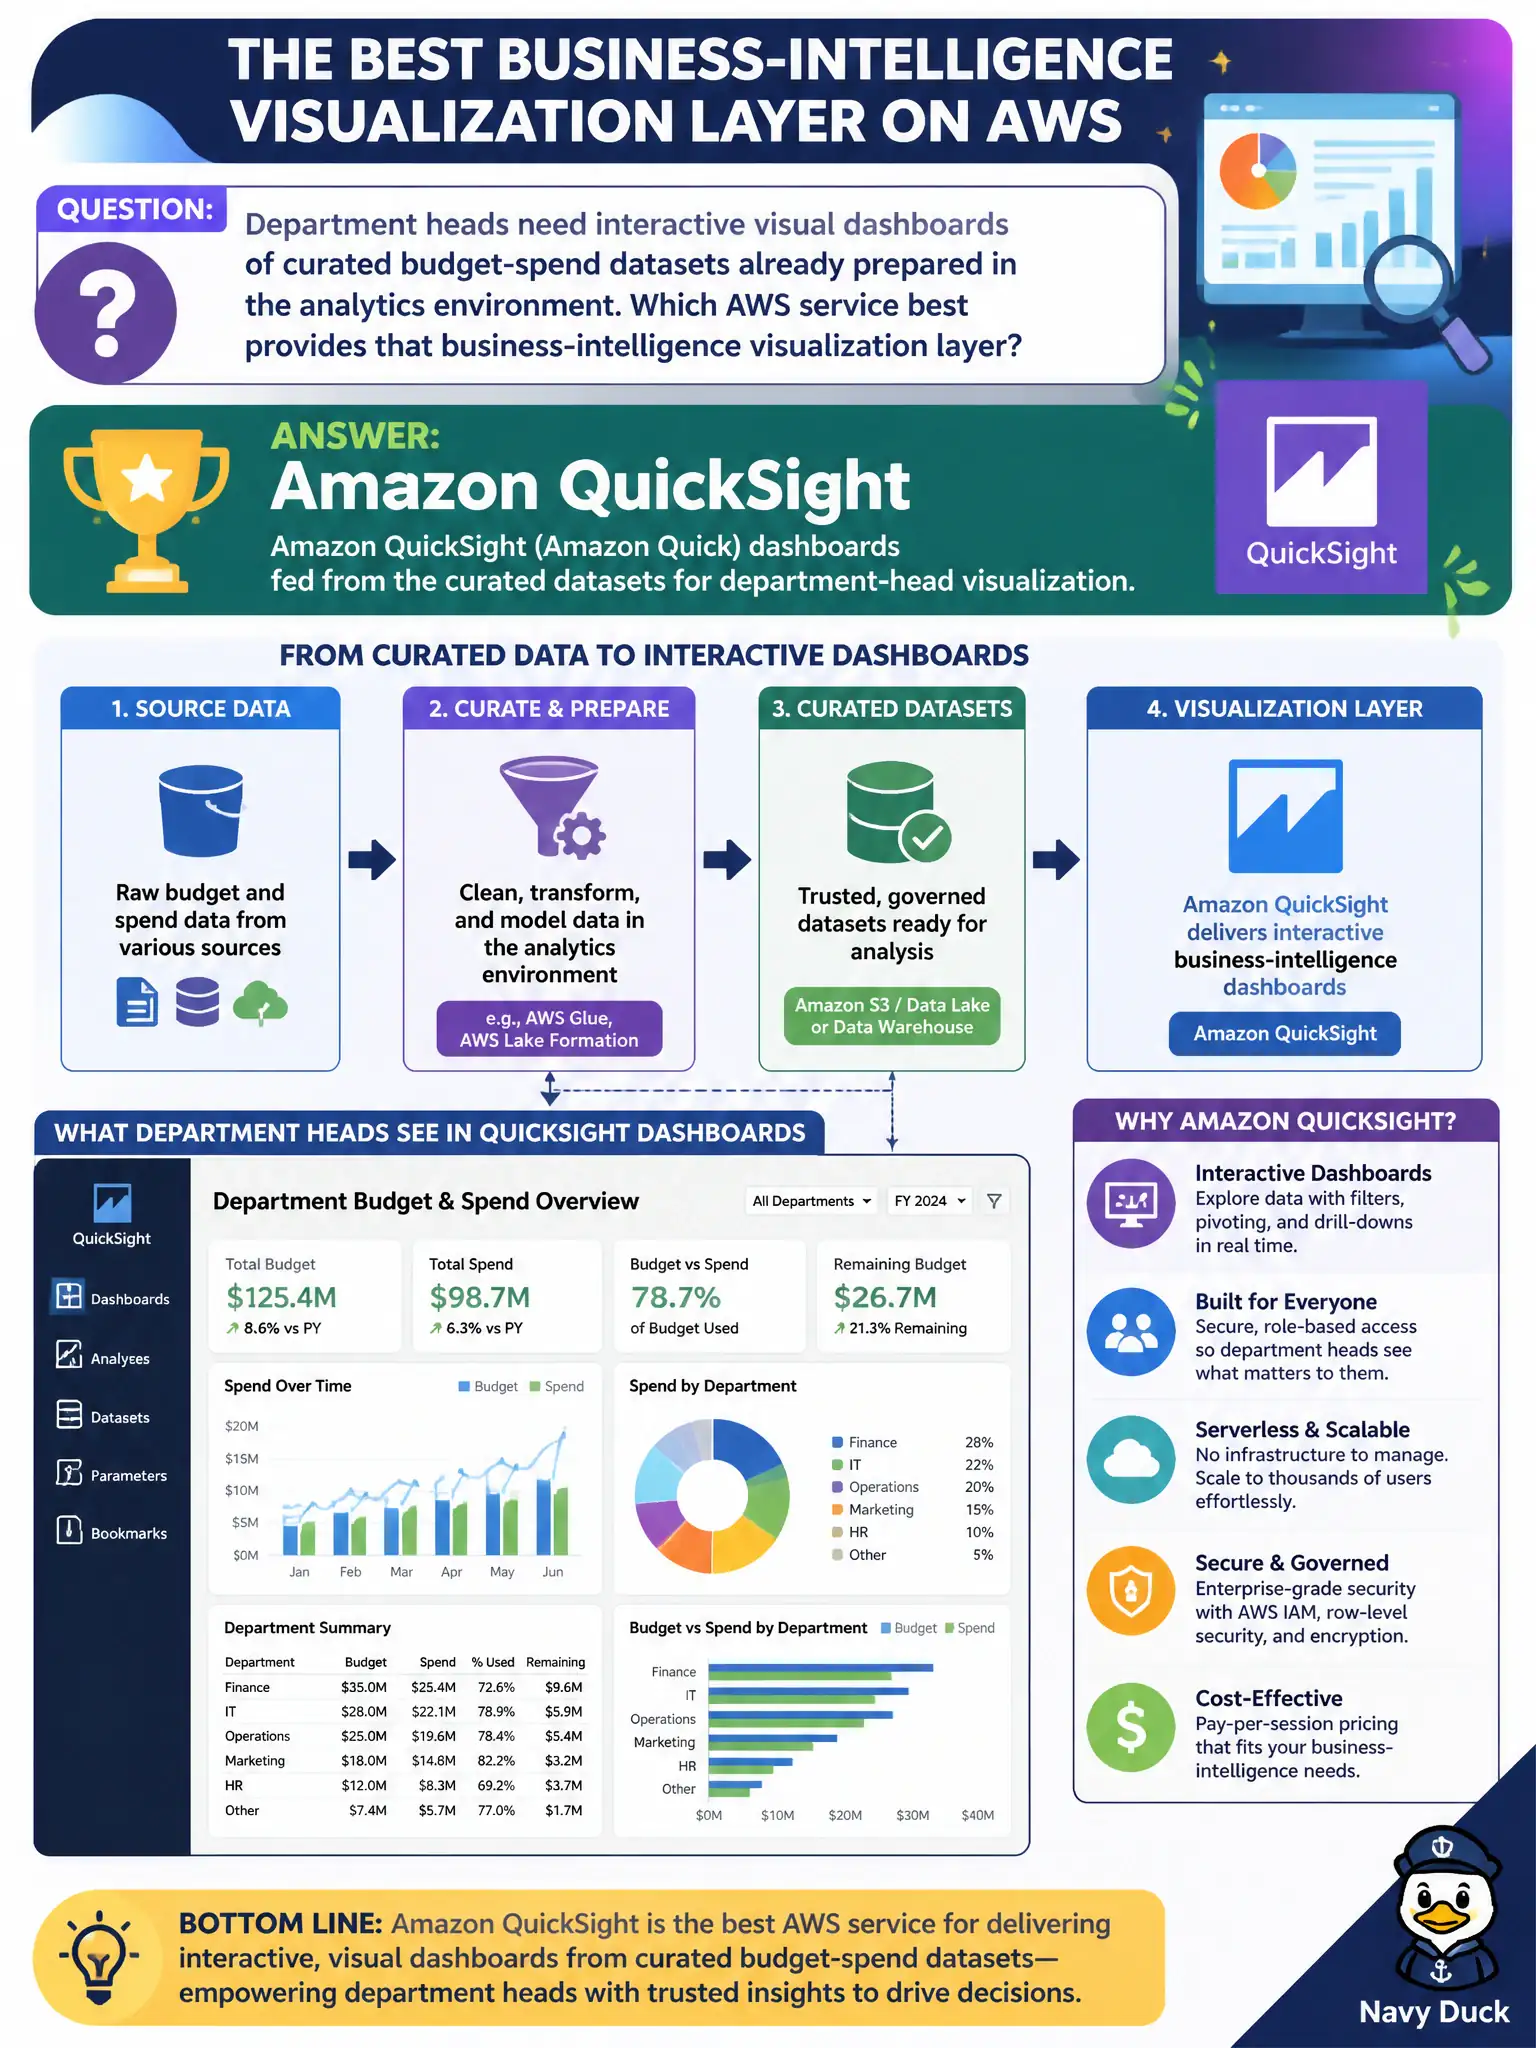
Department heads don’t want raw log greps—they want charts they can click. QuickSight (Amazon Quick) turns curated spend data into interactive dashboards for those leaders. CloudWatch Insights, Config drift graphs, and Route 53 health checks aren’t BI tools for budget storytelling.
Full Explanation
Amazon QuickSight (Amazon Quick) is the AWS business-intelligence visualization layer designed for interactive dashboards over curated datasets, which is exactly what department heads need for budget-spend storytelling. After finance or analytics teams prepare governed tables, QuickSight connects to those sources and presents charts, filters, and narratives that non-engineers can use in council or department reviews. Amazon CloudWatch Logs Insights is excellent for operational log investigation but is not a BI tool for curated budget narrative dashboards aimed at department heads. AWS Config rules chart configuration compliance drift, not dollar-spend storytelling for municipal budget oversight. Amazon Route 53 health checks plot endpoint health, which has no conceptual relationship to finance burn-down visualization. Exam caveat: dashboard quality depends on curated, permissioned datasets—QuickSight does not fix a messy lake by itself—and SPICE versus direct-query choices affect freshness and cost. Operational check: connect QuickSight to the curated spend dataset with least-privilege access, publish a pilot dashboard to a department-head group, validate figures against the source finance extract, and set refresh schedules that match reporting cadences.