
An emergency-management fusion cell needs neighborhood-level mean incident wait times over a multi-million-row CAD extract on a GPU. Which approach best fits cuDF?
Select an answer to reveal the explanation.
Short Explanation
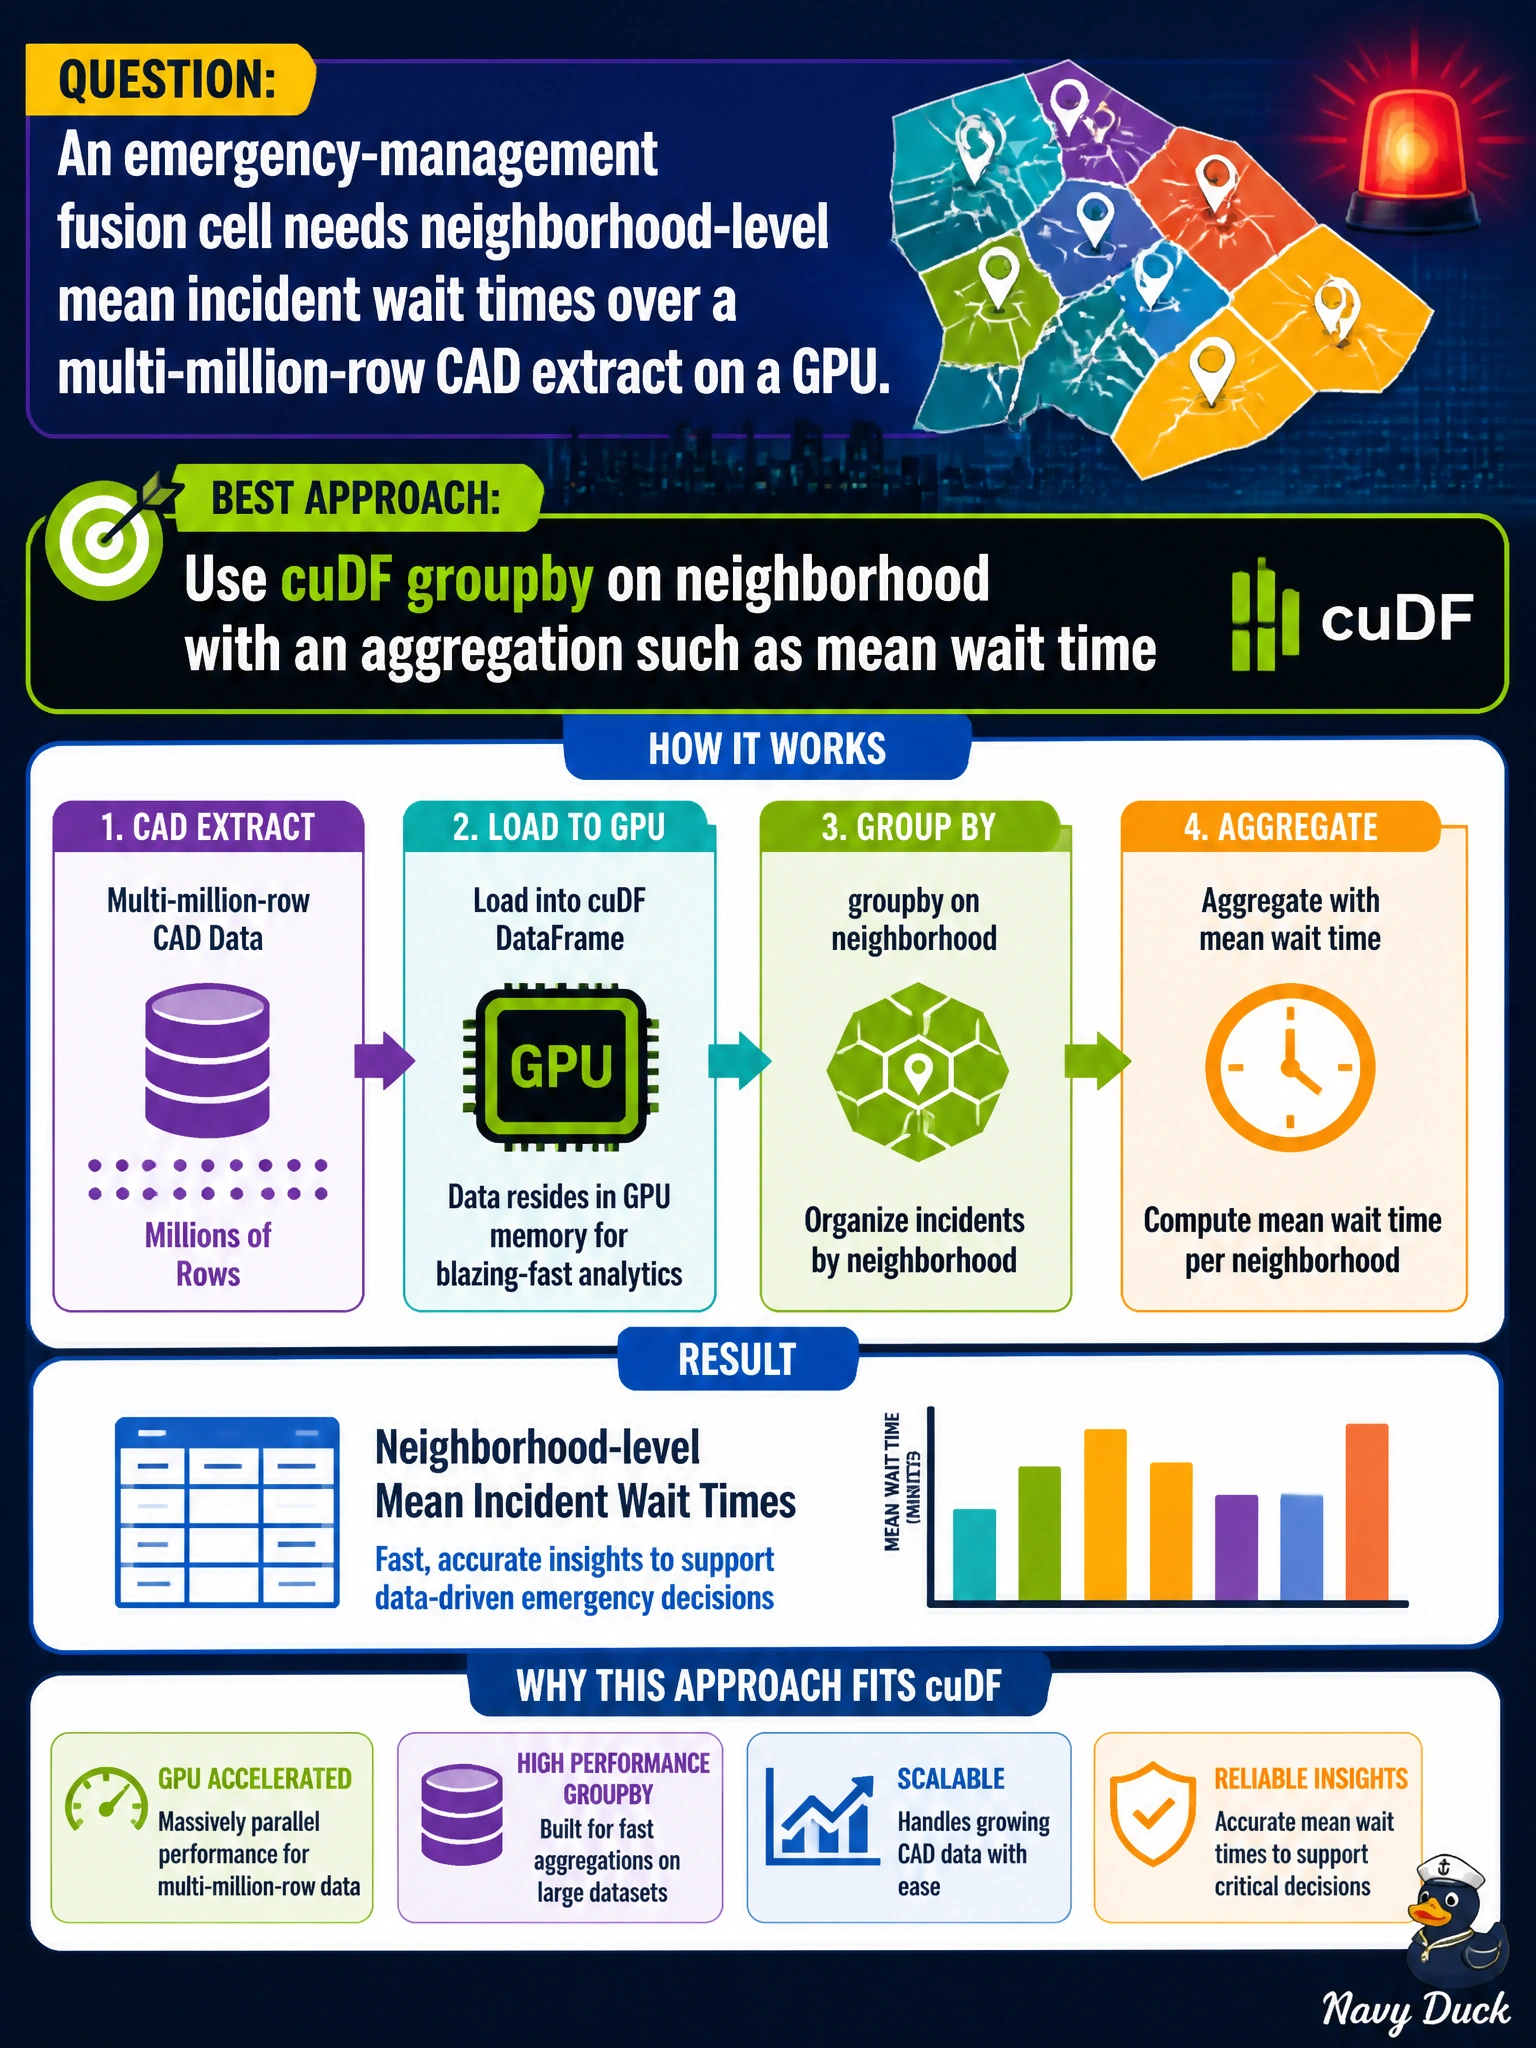
Grouping neighborhoods on the GPU is like sorting incident tickets into district bins and letting the calculator run once per bin. cuDF groupby plus mean does that in parallel. Row-by-row Python loops and hand averages choke on millions of CAD rows.
Full Explanation
Neighborhood-level mean incident wait times over multi-million-row CAD extracts are a classic split-apply-combine workload. cuDF groupby on neighborhood with an aggregation such as mean wait time executes that pattern on the GPU in parallel, which is the RAPIDS-native answer for emergency-management fusion analytics. Vectorized aggregation avoids Python-level iteration and keeps both grouping keys and measures in device memory through the reduce.
Iterating each row in a pure-Python for-loop to update a dict of neighborhood totals keeps the hot path on the CPU interpreter and cannot keep up with millions of CAD rows in operational SLAs. Printing every row to a console and averaging by hand is not an analytics method at civic scale and provides no reproducible pipeline. Training a generative chat model to invent neighborhood averages without grouping abandons aggregation entirely and replaces measured wait times with unverifiable text—unacceptable for emergency-management KPIs.
Exam caveat: groupby mean ignores nulls by default in pandas/cuDF-style APIs; decide explicitly how missing wait times should affect district metrics and whether you need count alongside mean. Operational check: run the GPU groupby on a fixture with known per-neighborhood means, assert totals and neighborhood cardinality, and spot-check a high-volume district against a CPU pandas baseline before trusting the fusion dashboard.