
A research team needs to analyze and visualize massive, high-dimensional datasets representing complex network graphs and real-time physical simulations. To handle the scale without choking their workstations, they require GPU-accelerated visualization and analytics tools. Which two technologies should they deploy to achieve this? (Select two)
Select all correct answers, then click Submit.
Short Explanation and Infographic
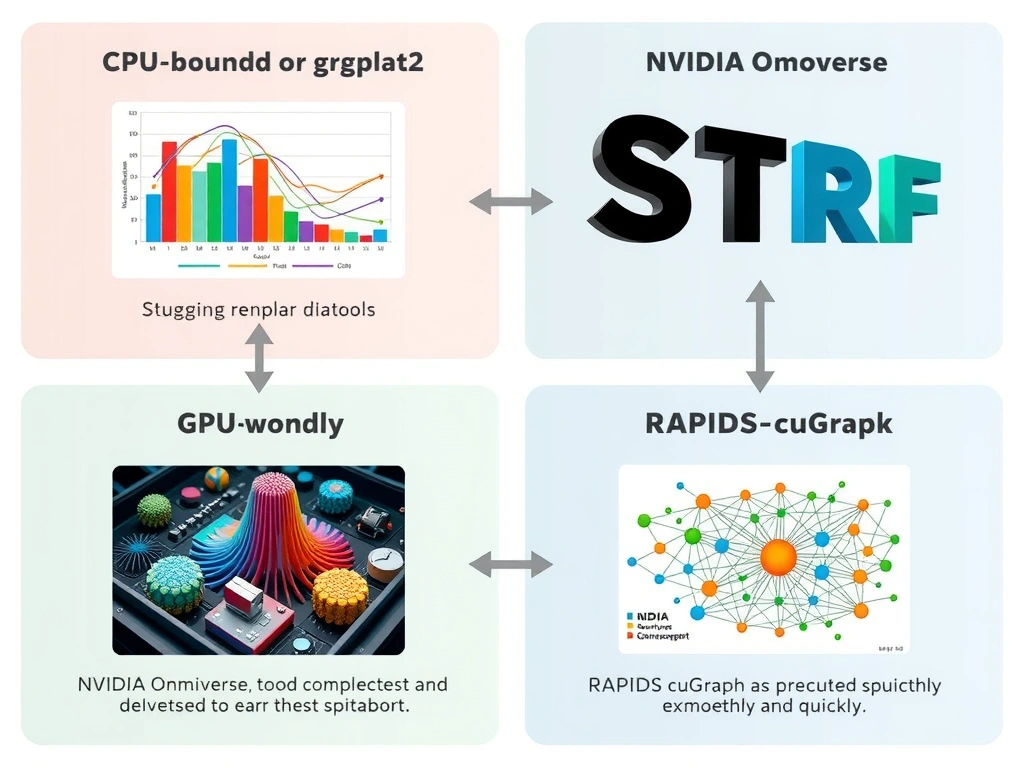
Here's the deal: if you try to render millions of data points or complex network graphs on a standard CPU-based tool, your system is going to crawl, and your screen will freeze. Not a fun day at the office! To handle massive datasets and physical simulations, you need to put the heavy lifting onto the GPU. That's where RAPIDS cuGraph and NVIDIA Omniverse come in. RAPIDS cuGraph is built specifically to run graph algorithms and visualizations directly in GPU memory using CUDA, which speeds things up by orders of magnitude. And if you need to visualize complex 3D physical data or collaborate on digital twins, NVIDIA Omniverse is the gold standard, rendering physically accurate worlds in real-time. Power BI and ggplot2 are great for basic charts, but when you're swimming in big data, you need GPU acceleration. Trust me on this!
Full explanation below image
Full Explanation
Visualizing large-scale, high-dimensional data or complex physical simulations presents significant computational challenges. Traditional data visualization tools rely on CPU-based rendering and single-threaded processing, which quickly bottleneck when dealing with millions of nodes, edges, or 3D rendering elements. To overcome these limitations, organizations leverage GPU-accelerated platforms designed for massive parallel workloads.
1. RAPIDS cuGraph: Part of the NVIDIA RAPIDS suite, cuGraph is a collection of GPU-accelerated graph algorithms. It allows data scientists to run graph analytics (such as PageRank, PageRank, and community detection) on massive network datasets directly in GPU memory (using CUDA). By avoiding host-to-device memory transfer bottlenecks and leveraging parallel GPU architecture, cuGraph can process and help visualize billions of edges in seconds, a task that would take hours on CPU-based frameworks. 2. NVIDIA Omniverse: This is a real-time, multi-GPU collaborative platform for 3D simulation and design. It uses advanced hardware-accelerated ray tracing (via NVIDIA RTX) and physics simulation engines to render complex, physically accurate 3D data visualizations and digital twins. Omniverse allows multiple users to collaborate simultaneously in virtual worlds, making it ideal for rendering complex spatial data, robotics simulations, and manufacturing workflows.
Let's look at the incorrect options: Tableau (CPU-based): While Tableau is a widely used business intelligence tool, its default configuration relies on CPU processing for rendering charts, which is not optimized for real-time 3D simulations or massive graph analytics. ggplot2 (R): ggplot2 is a popular statistical plotting package in R, but it runs on the CPU and struggles with rendering performance when handling extremely large datasets. * Apache Spark SQL: While Spark SQL is excellent for distributed data processing, it is a query execution engine that runs on CPU memory clusters by default, and does not provide GPU-accelerated 3D rendering or specialized graph visualization capabilities.