
You are evaluating two predictive models designed to forecast a company's monthly revenue based on marketing spend and seasonal factors. One model uses a linear regression model, and the other uses a gradient-boosted decision tree. Which two evaluation metrics should you use to assess and compare the performance of these regression models? (Select two)
Select all correct answers, then click Submit.
Short Explanation and Infographic
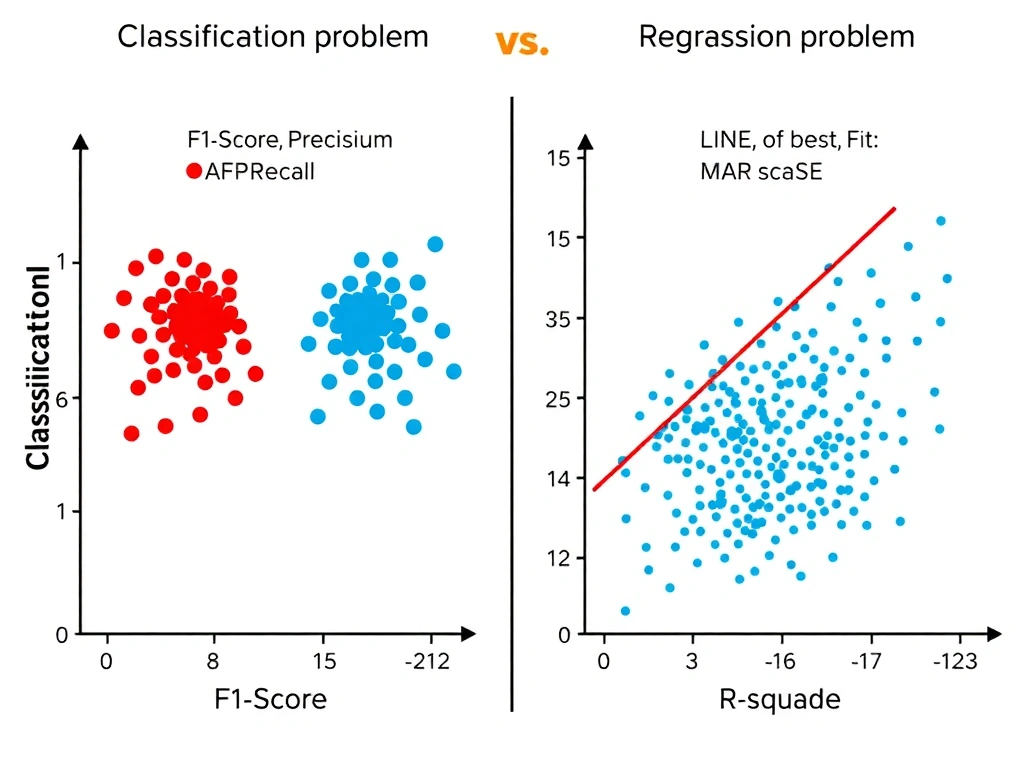
Let's dive in: before you choose which model to put in front of your clients, you have to measure how well they actually predict real, continuous numbers (like dollars or prices). We're talking about regression here, not classification! So you can throw out anything that deals with sorting things into bins—like precision or AUC-ROC. Instead, you want to know two things: 'On average, how far off are my predictions?'—which is exactly what Mean Absolute Error (MAE) tells you—and 'How well does my model explain the variance in the actual data?'—which is what R-squared is for. Trust me, keep your metrics aligned with your problem type, or you'll end up deploying a model that doesn't do what you think it does.
Full explanation below image
Full Explanation
When comparing machine learning models, the choice of evaluation metrics depends entirely on the nature of the target variable. Since predicting revenue involves forecasting a continuous numerical value rather than categorizing data into discrete classes, it is a regression problem. The two most appropriate metrics for regression analysis are: 1. Mean Absolute Error (MAE): This metric measures the average magnitude of the errors in a set of predictions, without considering their direction. It is calculated as the average of the absolute differences between the predicted values and the actual values. MAE provides a direct, easily interpretable measure of prediction accuracy in the same units as the target variable (e.g., dollars). 2. R-squared (Coefficient of Determination): This is a statistical measure that represents the proportion of the variance for a dependent variable that's explained by an independent variable or variables in a regression model. It ranges from 0 to 1 (or 0% to 100%), indicating the model's goodness-of-fit and reliability.
Why Distractors are Incorrect: A) Precision and Recall: These are evaluation metrics designed for classification tasks (e.g., determining if an email is spam or not). They rely on true/false positives and negatives, which do not exist in continuous numerical predictions. C) Area Under the ROC Curve (AUC-ROC): This is another classification metric that evaluates the performance of a binary classifier across various threshold settings. It is irrelevant for evaluating continuous numerical predictions. * E) Learning Rate: This is a hyperparameter used to control the step size at each iteration during the optimization process (like gradient descent) when training a model. It is not a performance metric used to evaluate or compare trained models.