During a large-scale LLM training run across an enterprise cluster, several distributed nodes experience sudden slowdowns and sporadic job failures. The operations team needs a dedicated, low-overhead monitoring solution that runs directly on the nodes to perform real-time GPU diagnostics, track hardware health, and flag memory or thermal issues before they derail the job. Which action should they take?
Select an answer to reveal the explanation.
Short Explanation and Infographic
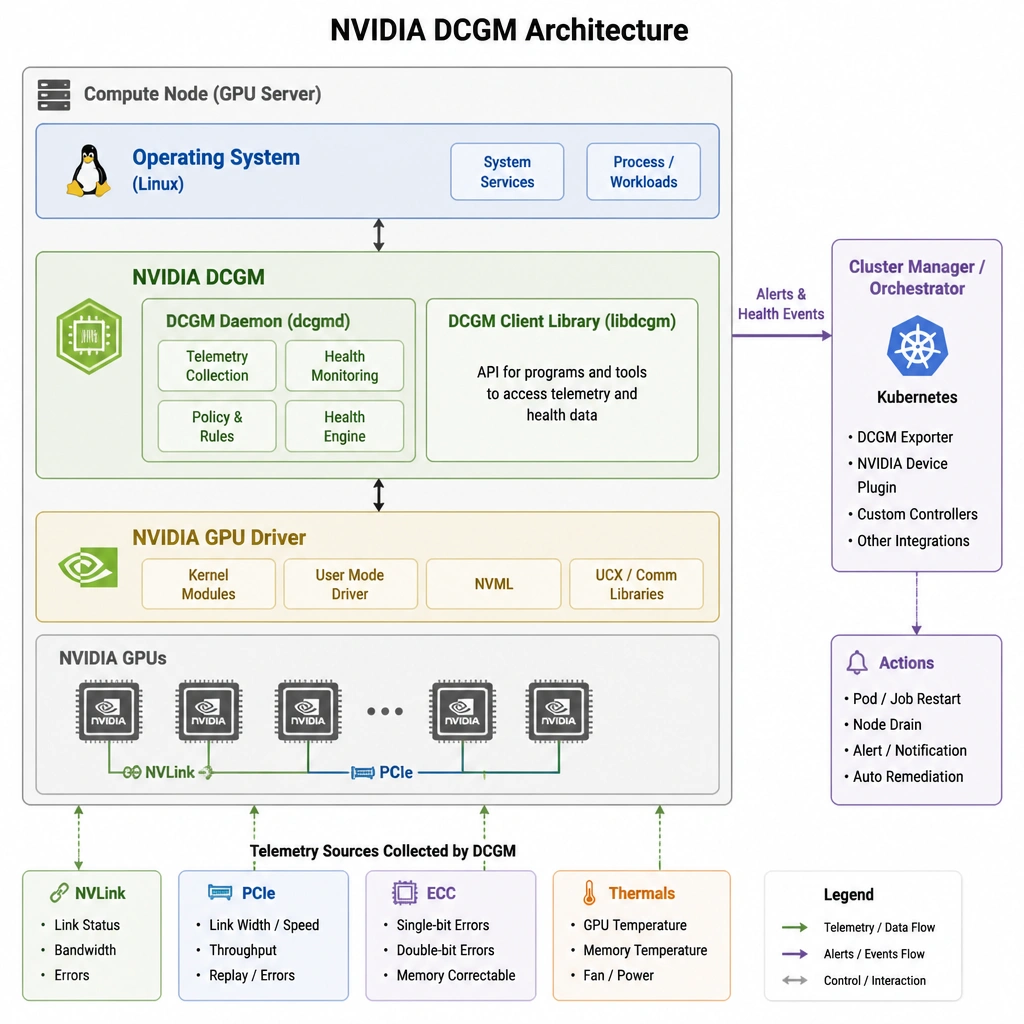
Alright, let's dive into this one. If your GPUs are slowing down or failing, you need tools built specifically for the job. Standard operating system tools are blind to what's happening inside a GPU's memory or execution cores. That's where NVIDIA's Data Center GPU Manager—DCGM—comes in. Think of DCGM as the ultimate dashboard and diagnostic kit for your GPU cluster. It handles health monitoring, diagnostics, and telemetry out of the box with almost zero overhead. Relying on basic syslogs or generic CPU/NIC metrics won't help you catch NVLink failures or memory errors before a run crashes. Save yourself the headache and configure DCGM!
Full explanation below image
Full Explanation
NVIDIA Data Center GPU Manager (DCGM) is a suite of tools designed specifically for managing and monitoring NVIDIA GPUs in clustered environments. It includes active health monitoring, diagnostics, policy management, and telemetry association. DCGM can identify issues such as thermal throttling, PCIe bottlenecks, NVLink degradation, and memory errors (like uncorrectable ECC errors). By running continuously with low overhead, it provides cluster managers and orchestrators (like Kubernetes) with the necessary data to dynamically manage GPU resources and alert administrators of potential hardware issues before they cause job failures. Let's analyze the distractors. Option B (parsing syslog for PCIe errors) is extremely manual and complex to configure. It only captures system-level reports and misses detailed GPU telemetry like tensor core utilization, thermal limits, or NVLink issues. Option C (cron job running nvidia-smi and restarting) is a reactive, brute-force approach. Polling every 10 minutes is too slow to catch real-time spikes, and automatically rebooting servers can disrupt healthy workloads sharing the same node. Option D (monitoring CPU usage and NIC latency) is too high-level. While network latency affects distributed training, generic NIC and CPU metrics will not expose internal GPU performance bottlenecks, memory errors, or NVLink issues.