A data science team is evaluating two linear regression models designed to forecast energy consumption. Model A yields a coefficient of determination ($R^2$) of 0.72, whereas Model B achieves an $R^2$ of 0.88. Based strictly on the $R^2$ metric, which model is preferred, and what does this metric tell you about the model's fit?
Select an answer to reveal the explanation.
Short Explanation and Infographic
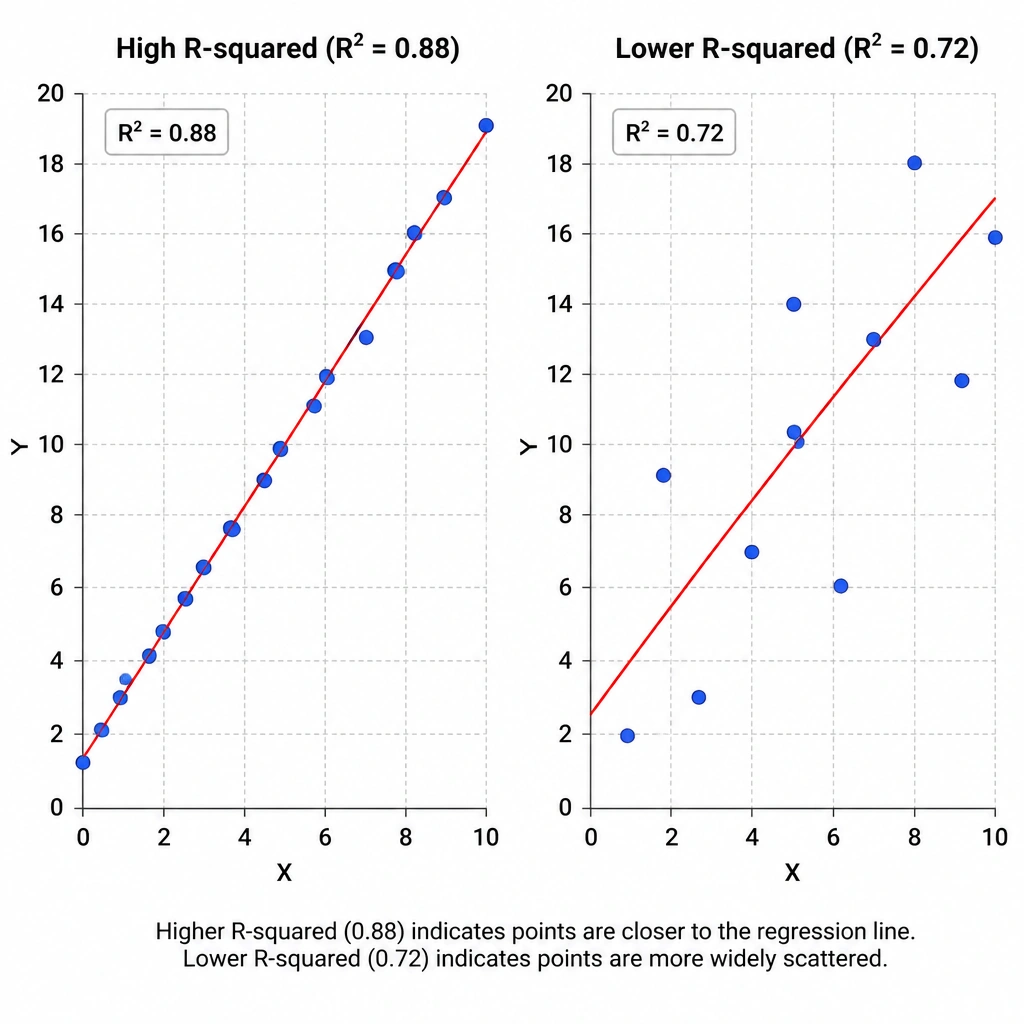
Check this out: when you're looking at regression models, you need a way to tell how well your model actually fits the data. That's where $R^2$, or the coefficient of determination, comes in. Think of $R^2$ as a scorecard that ranges from 0 to 1 (or 0% to 100%). It tells you what percentage of the variance in your output—like energy use or stock prices—is actually explained by your model's inputs. So if Model B has an $R^2$ of 0.88, it explains 88% of the variance, while Model A only explains 72%. Clearly, Model B is doing a better job fitting the data we've got. Now, don't get tripped up thinking a lower $R^2$ is somehow better because of "flexibility," and definitely don't confuse regression metrics with classification metrics. Stick to the basics: higher $R^2$ means more explained variance. Got it? Sweet.
Full explanation below image
Full Explanation
The coefficient of determination, denoted as $R^2$ (pronounced "R-squared"), is a standard metric used to evaluate the performance of regression models. It represents the proportion of variance in the dependent (target) variable that can be explained by the independent (predictor) variables in the model. The value of $R^2$ ranges from 0 to 1, where 0 indicates the model explains none of the variability around its mean, and 1 indicates it explains all of the variability. Therefore, when comparing two models using this metric, the one with the higher $R^2$ value is preferred because it fits the data points more closely and explains a greater portion of the data's variance.
Let's break down the incorrect options: - Option A is incorrect because a lower $R^2$ does not indicate superior flexibility or generalizability. A lower value simply means the model fails to capture a larger portion of the variance in the target dataset. - Option C is incorrect because $R^2$ does not measure homoscedasticity (the constant variance of residuals). Homoscedasticity must be evaluated using residual plots or formal statistical tests like the Breusch-Pagan test. - Option D is incorrect because $R^2$ is specifically designed for regression analysis to assess how well a model predicts continuous values; it is not a classification metric.
While a high $R^2$ is generally desirable, practitioners should also monitor for overfitting by comparing training $R^2$ with adjusted $R^2$ or testing set performance.