You are evaluating and comparing three different classification models (logistic regression, decision tree, and a neural network) developed to predict subscriber cancellation (churn). Customer churn datasets are notoriously imbalanced, as only a small fraction of users cancel at any given time. Which of the following metrics and loss functions are the most appropriate choices for this classification analysis? (Select two)
Select all correct answers, then click Submit.
Short Explanation and Infographic
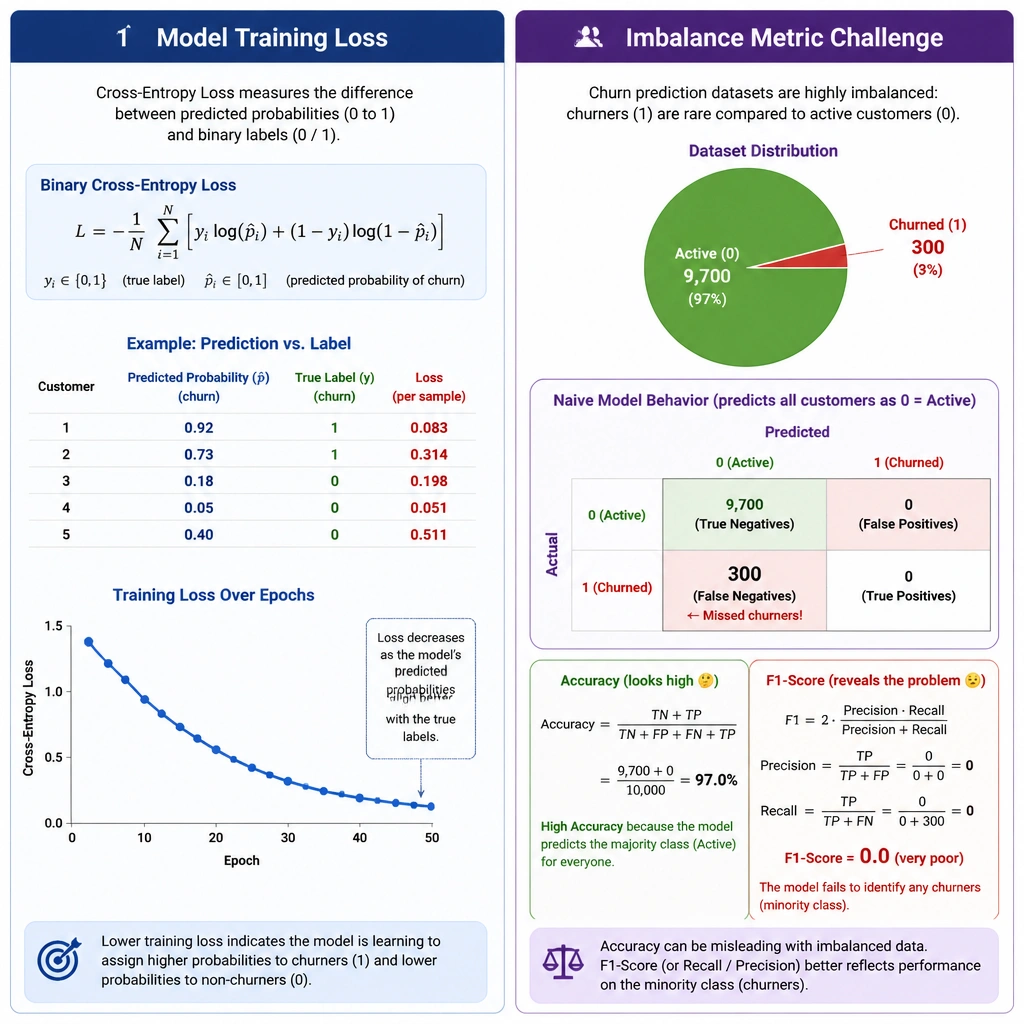
Okay, let's dive in. Predicting customer churn is a classification problem—either the customer stays, or they walk. Since most customers stay, the dataset is going to be heavily imbalanced. If 99% of your customers stay, and your model just guesses "stay" every single time, it has a 99% accuracy rate! That sounds awesome, but it's completely useless because you missed every single cancellation. That's why raw accuracy is a trap here. Instead, you need the F1-score, which balances precision and recall so you know how well you're actually finding those churners. And for training your models, you need a loss function that measures the distance between the predicted probability and the actual class (0 or 1). That's cross-entropy loss. MSE and R-squared are for regression (predicting continuous numbers like house prices), so ignore them here!
Full explanation below image
Full Explanation
Customer churn prediction is a binary classification task where the goal is to predict whether a customer will cancel their service (Class 1) or remain (Class 0). Because churn events are relatively rare, the target class is typically highly imbalanced.
1. F1-Score for Imbalanced Data: Standard metrics like classification accuracy can be misleading in imbalanced contexts. If 95% of the dataset consists of active customers, a naive model that predicts "no churn" for every input will achieve 95% accuracy while completely failing to identify the churn risk. The F1-score is the harmonic mean of precision (the fraction of predicted churns that were actual churns) and recall (the fraction of actual churns that were correctly identified). It provides a balanced metric that penalizes models failing to capture the minority class. 2. Cross-Entropy Loss for Classification: Cross-entropy (also called log loss) measures the performance of a classification model whose output is a probability value between 0 and 1. It increases as the predicted probability diverges from the actual label. This is the standard loss function for logistic regression and classification neural networks (using a sigmoid or softmax activation function in the output layer), as it penalizes confident but incorrect predictions.
Let's address the distractors: Option B (R-squared) is a statistical measure of how close the data are to the fitted regression line, used exclusively in regression tasks, not binary classification. Option C (Mean Squared Error) is a common loss function for regression tasks that measures the average squared difference between estimated values and the actual value. It is inappropriate for classification models like decision trees or logistic regression predicting discrete class memberships. Option E (raw accuracy) is a poor metric for imbalanced datasets due to the accuracy paradox discussed above.