During distributed training of a large language model across a cluster of DGX servers, you notice that overall training epoch times are higher than expected. To identify the exact cause of this bottleneck, what monitoring strategy should you implement?
Select an answer to reveal the explanation.
Short Explanation and Infographic
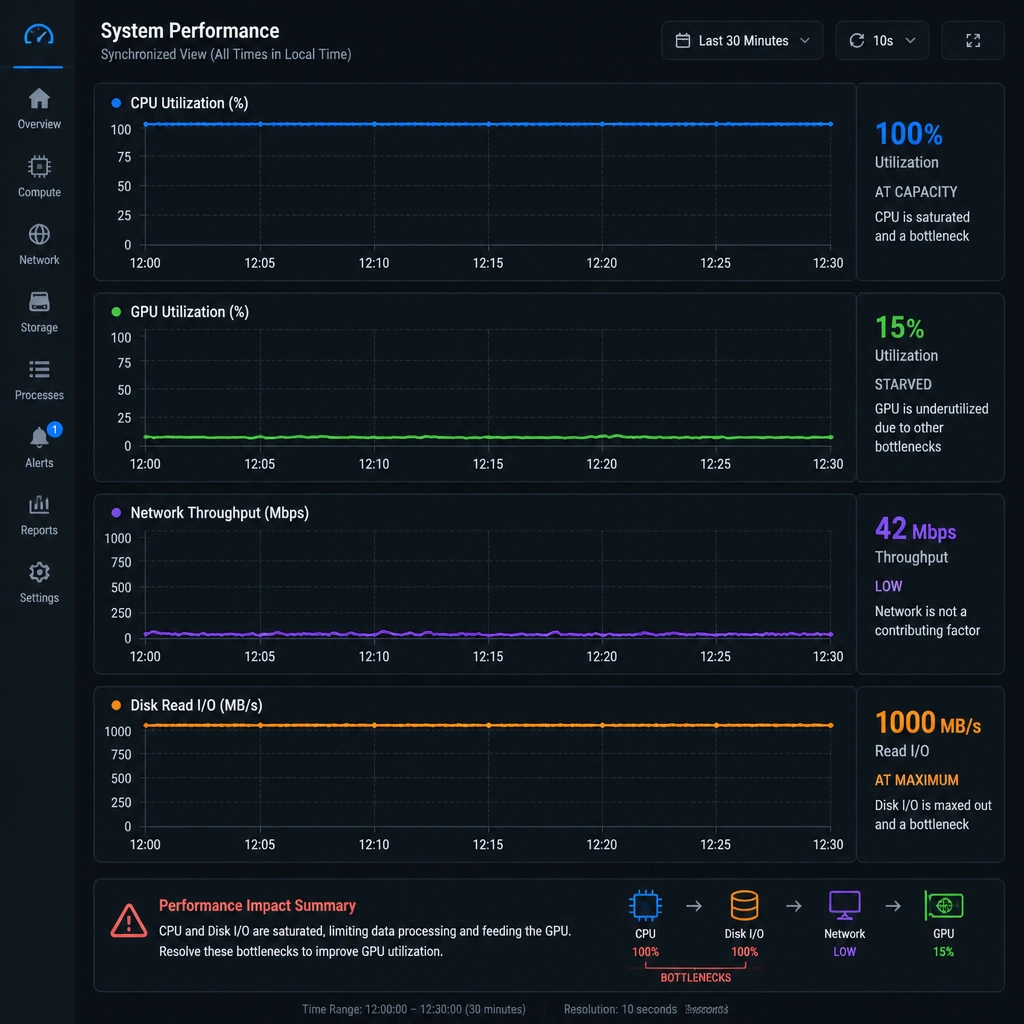
Here's the deal: if your GPUs are sitting at 20% utilization, you might think, 'Oh, I just need faster GPUs!' But wait a minute. What if your CPU is maxed out at 100% trying to preprocess images, or your network switch is choked trying to sync parameters between nodes? Your GPUs are just sitting there waiting for data. If you only look at GPU metrics, you're flying blind. You have to monitor the entire picture—CPU, GPU, memory, and network throughput—simultaneously. If you see GPU usage drop while network usage spikes, boom, you've found your bottleneck. That's how we troubleshoot in the real world. Monitoring job times only tells you that you're slow, not why you're slow. Got it? Sweet. Let's keep rolling.
Full explanation below image
Full Explanation
In accelerated computing environments, performance bottlenecks can occur at various stages of the data pipeline. High-performance GPUs require a constant stream of data to keep their CUDA and Tensor Cores saturated. Consequently, monitoring only GPU metrics is insufficient.
A holistic monitoring approach tracks four main resources simultaneously: 1. GPU Utilization and Memory: High GPU utilization indicates the workload is successfully running on the accelerator. If utilization is low, the GPU is likely starved for data. 2. CPU Utilization: The CPU is responsible for data loading, decompression, preprocessing, and augmentation. If the CPU is bottlenecked, the GPU remains idle. 3. PCIe and Network Fabric (InfiniBand/RoCE): Distributed training requires nodes to exchange gradients frequently. If the network fabric experiences high latency or packet loss, GPUs will stall during communication phases (such as AllReduce operations). 4. System Memory (RAM) and Disk I/O: Slow storage read speeds can limit how fast datasets are fed into the system.
Let's look at the incorrect options: - Option A: Monitoring only the GPU fails to diagnose why the GPU is underutilized. It ignores the upstream data path (CPU, memory, storage) and downstream communication path (networking). - Option C: Relying on job completion times is a reactive, black-box approach. While it flags that a run is slow, it provides no technical telemetry to diagnose the root cause of the slowdown. - Option D: Predictive scaling based on utilization forecasts does not resolve internal hardware bottlenecks; it merely replicates the bottlenecked configuration across more nodes, wasting expensive resources.
Thus, correlating CPU, GPU, memory, and network fabric metrics simultaneously is the most effective strategy to detect and resolve cluster bottlenecks.