You are conducting a meta-analysis on hundreds of deep learning experiments to understand how various input factors—such as dataset noise level, training sample size, batch size, and regularization strength—interact to cause model overfitting. Which analytical approach will best allow you to map and interpret these complex, multi-variable relationships and determine which factors are the strongest predictors of overfitting?
Select an answer to reveal the explanation.
Short Explanation and Infographic
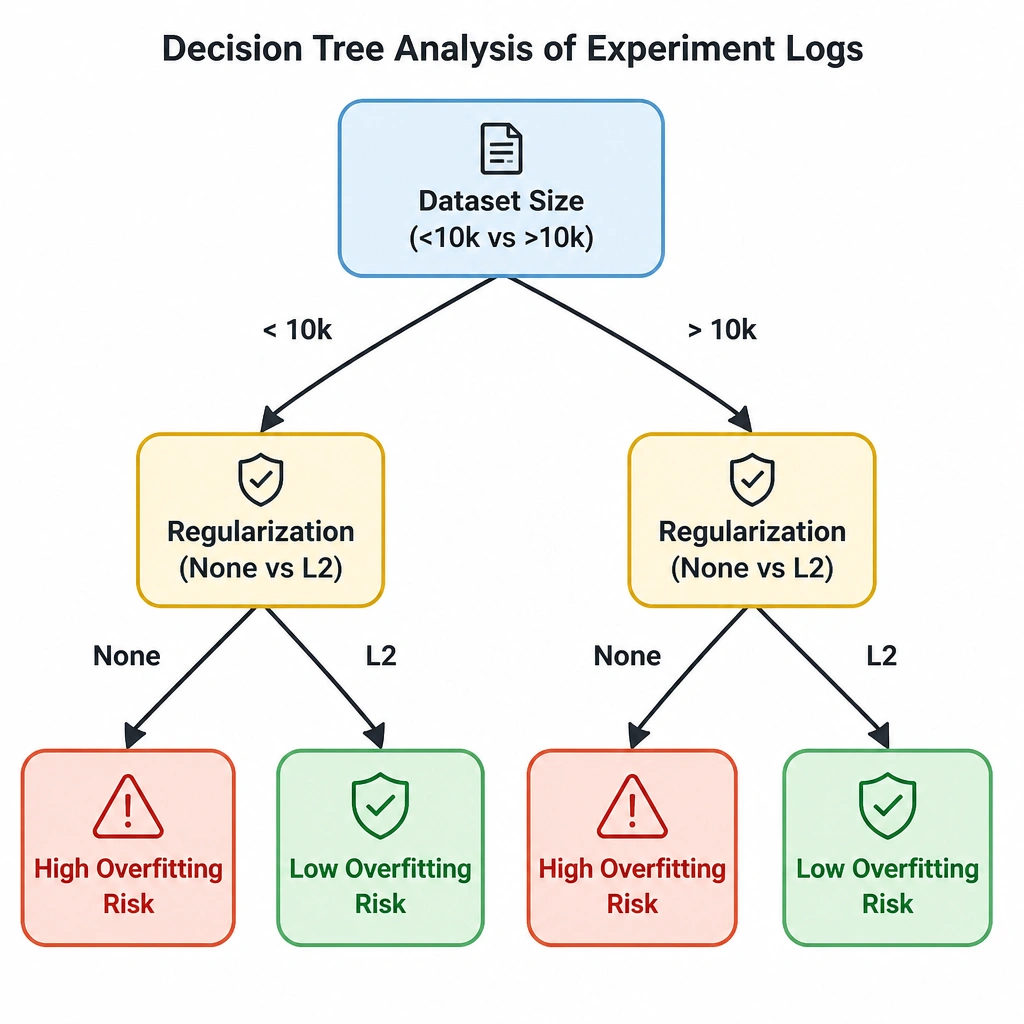
Check this out: when you're looking at a complex problem like model overfitting, it's rarely just one thing causing the issue. It's not just your batch size, and it's not just your dataset size—it's how they interact. A simple scatter plot or a histogram can only show you one or two dimensions at a time, which means you're going to miss the big picture. But if you train a decision tree on your experimental data, it acts like a detective. It splits your data step-by-step based on the most critical factors, showing you exactly how combinations of hyperparameters and dataset traits lead to overfitting. It's a killer way to get clear, actionable rules from messy experimental data.
Full explanation below image
Full Explanation
Analyzing the behavior of machine learning models across many experiments involves evaluating high-dimensional data. The risk of overfitting is determined not by a single hyperparameter or dataset characteristic in isolation, but by their complex, non-linear interactions (e.g., a high learning rate might only cause overfitting when combined with a small dataset and low dropout). 1. Decision Tree Analysis: A decision tree is an excellent tool for this type of exploratory analysis because it recursively partitions the data based on feature values that maximize the split's purity (e.g., classifying experiments into 'overfitted' vs. 'generalized'). The resulting tree structure provides a visual, rule-based representation of how different variables interact. By analyzing the splits, you can identify which variables are the most critical predictors (feature importance) and trace the specific combinations of dataset traits and hyperparameters that lead to high overfitting rates.
Why Distractors are Incorrect: A) Plotting a series of single-variable histograms for each hyperparameter: Histograms show the distribution of a single variable at a time. They cannot show correlation, multi-variable interactions, or how these hyperparameters relate to the actual outcome of overfitting. C) Generating a scatter plot mapping validation accuracy against epoch number: This is useful for tracking a single model's training progress over time (loss curves), but it does not compare multiple configurations or identify how different dataset characteristics and hyperparameters interact across hundreds of distinct runs. * D) Performing a standard correlation analysis using Pearson's correlation coefficient: Pearson's correlation only measures linear relationships between two continuous variables. It fails to capture complex, non-linear interactions or categorical relationships (like optimizer types) that influence overfitting.