
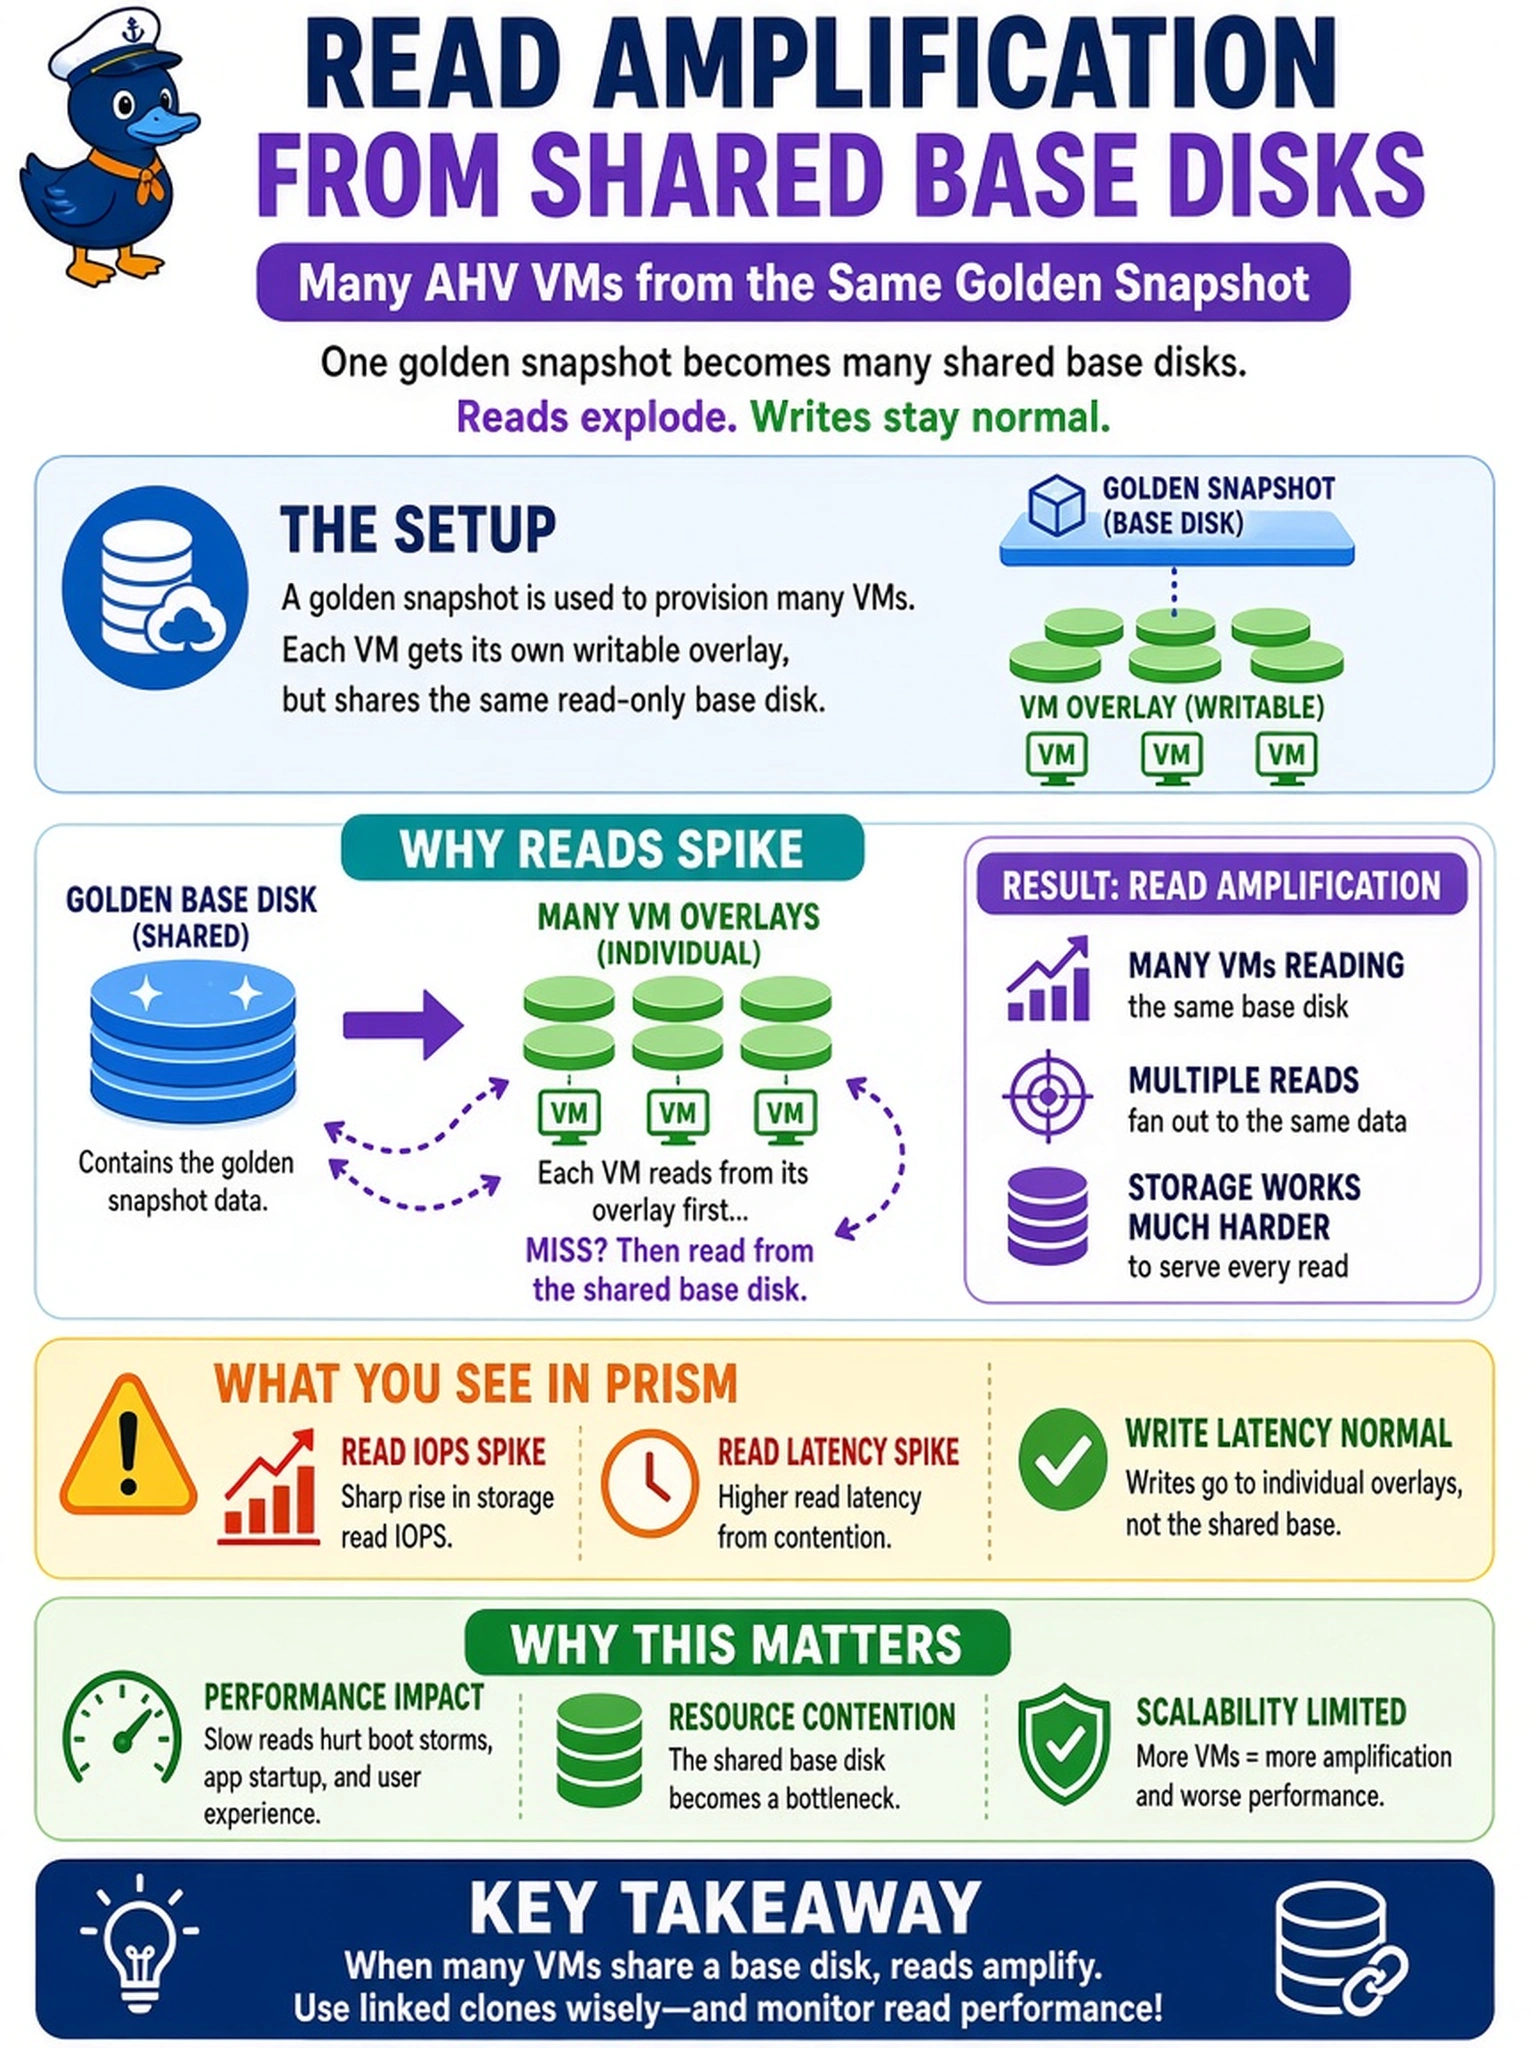
A lab powers on many AHV VMs provisioned from the same golden snapshot. Prism shows a sharp rise in storage read IOPS and read latency, while write latency remains normal. Which issue best explains the spike?
Select an answer to reveal the explanation.
Short Explanation
Think of a golden snapshot like one popular PDF everyone opens at once: the reads all hit the same shared blocks. If fifty VMs boot from that same base, you get a read storm that looks like a storage latency problem. The writes look fine because they land on new blocks, so don't blame the management plane or network.
Full Explanation
When many VMs are launched from the same golden snapshot, their unchanged disks can reference the same base blocks. Every guest read to those blocks becomes a storage read against a common working set, multiplying read IOPS and creating hotspots on the underlying extents. Write latency stays normal because the writes are redirected to new blocks, while the read path is shared. A CVM metadata or snapshot consolidation problem would usually affect control-plane operations, cause write or compaction symptoms, or show CVM CPU and metadata queueing rather than a pure read spike. Prism Central metric collection overhead can make dashboards slow or increase API load, but it does not create sustained storage read IOPS or container read latency. AHV bridge broadcast storms from simultaneous NIC initialization affect network latency, CPU, or ARP traffic, not the storage read path. Exam caveat: on an exam, match the symptom to the plane and direction: shared snapshot reads point to storage read amplification, not management polling or network storms. Operational check: compare container read latency and read IOPS to the power-on window, identify VMs sharing the snapshot, then stagger boots, use independent copies, or increase caching for the hot base blocks.