
A county-museum chatbot corpus has a pile of one-word captions and a few entire catalog PDFs pasted as one document. What plot helps them cap, split, or drop before ingest?
Select an answer to reveal the explanation.
Short Explanation
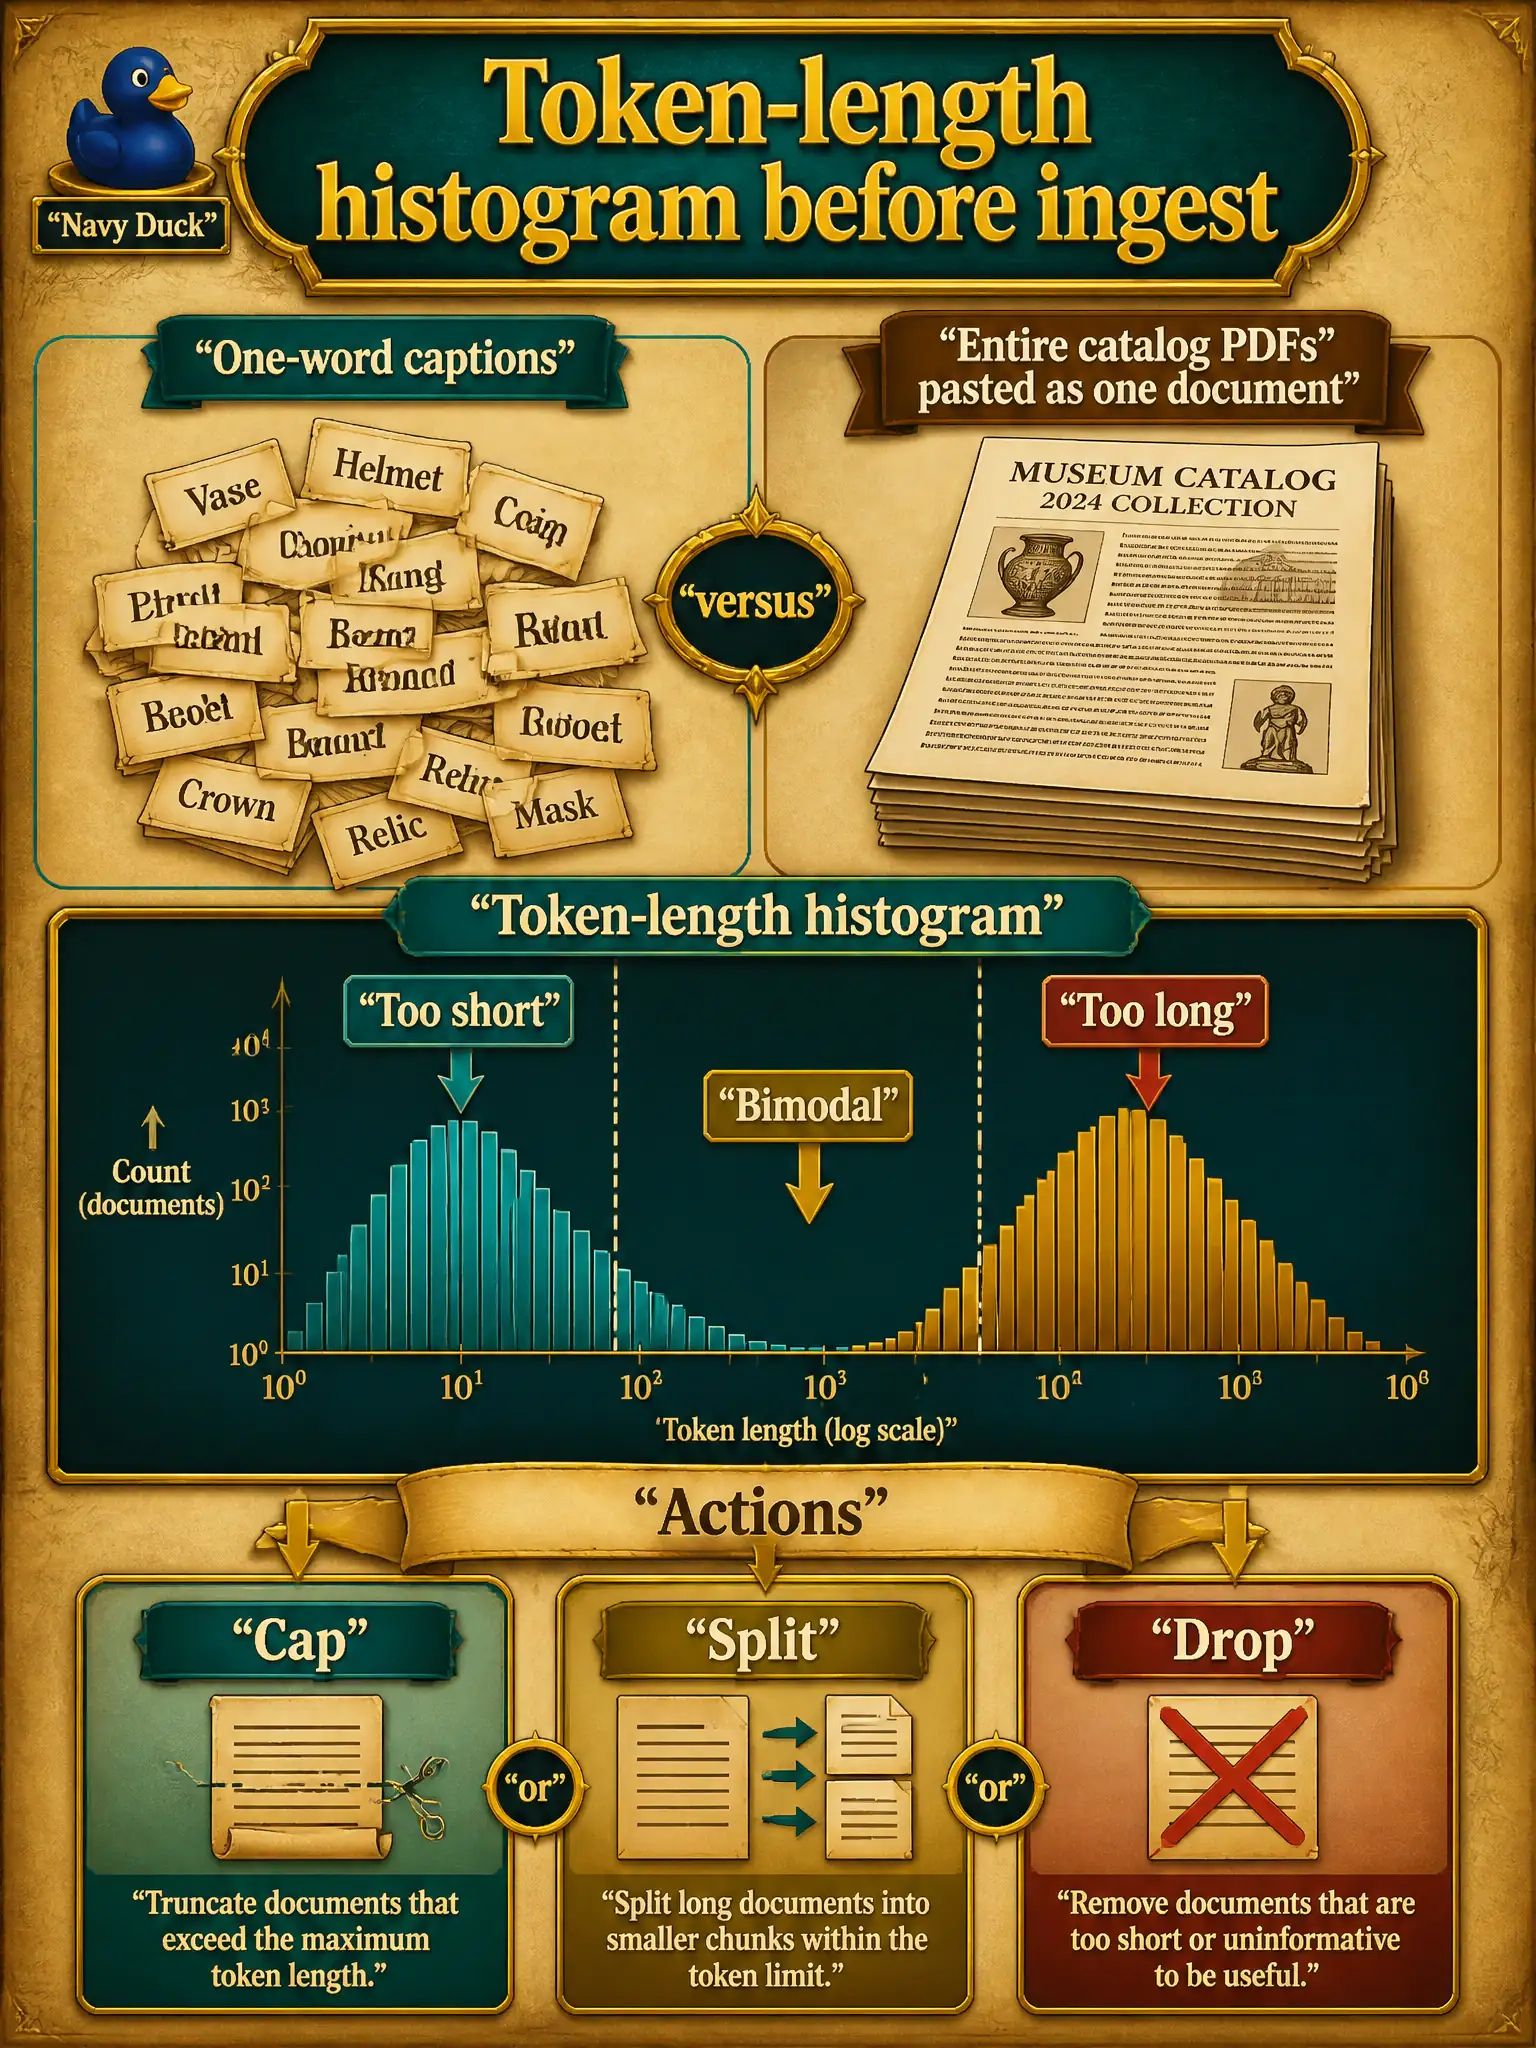
One-word captions and whole catalog PDFs pasted as one document. A token-length histogram shows too short, too long, or bimodal so they can cap, split, or drop. A context-window lecture, a Triton latency chart, and a model card do not replace that plot.
Full Explanation
Length plots are the associate way to see whether text is too short, too long, or bimodal. One-word captions and whole PDFs pasted as one document are that pattern. This is a data and visualization item, not a context-window definition, not a serving chart, and not a model card. Use the histogram to cap, split, or drop before ingest.