
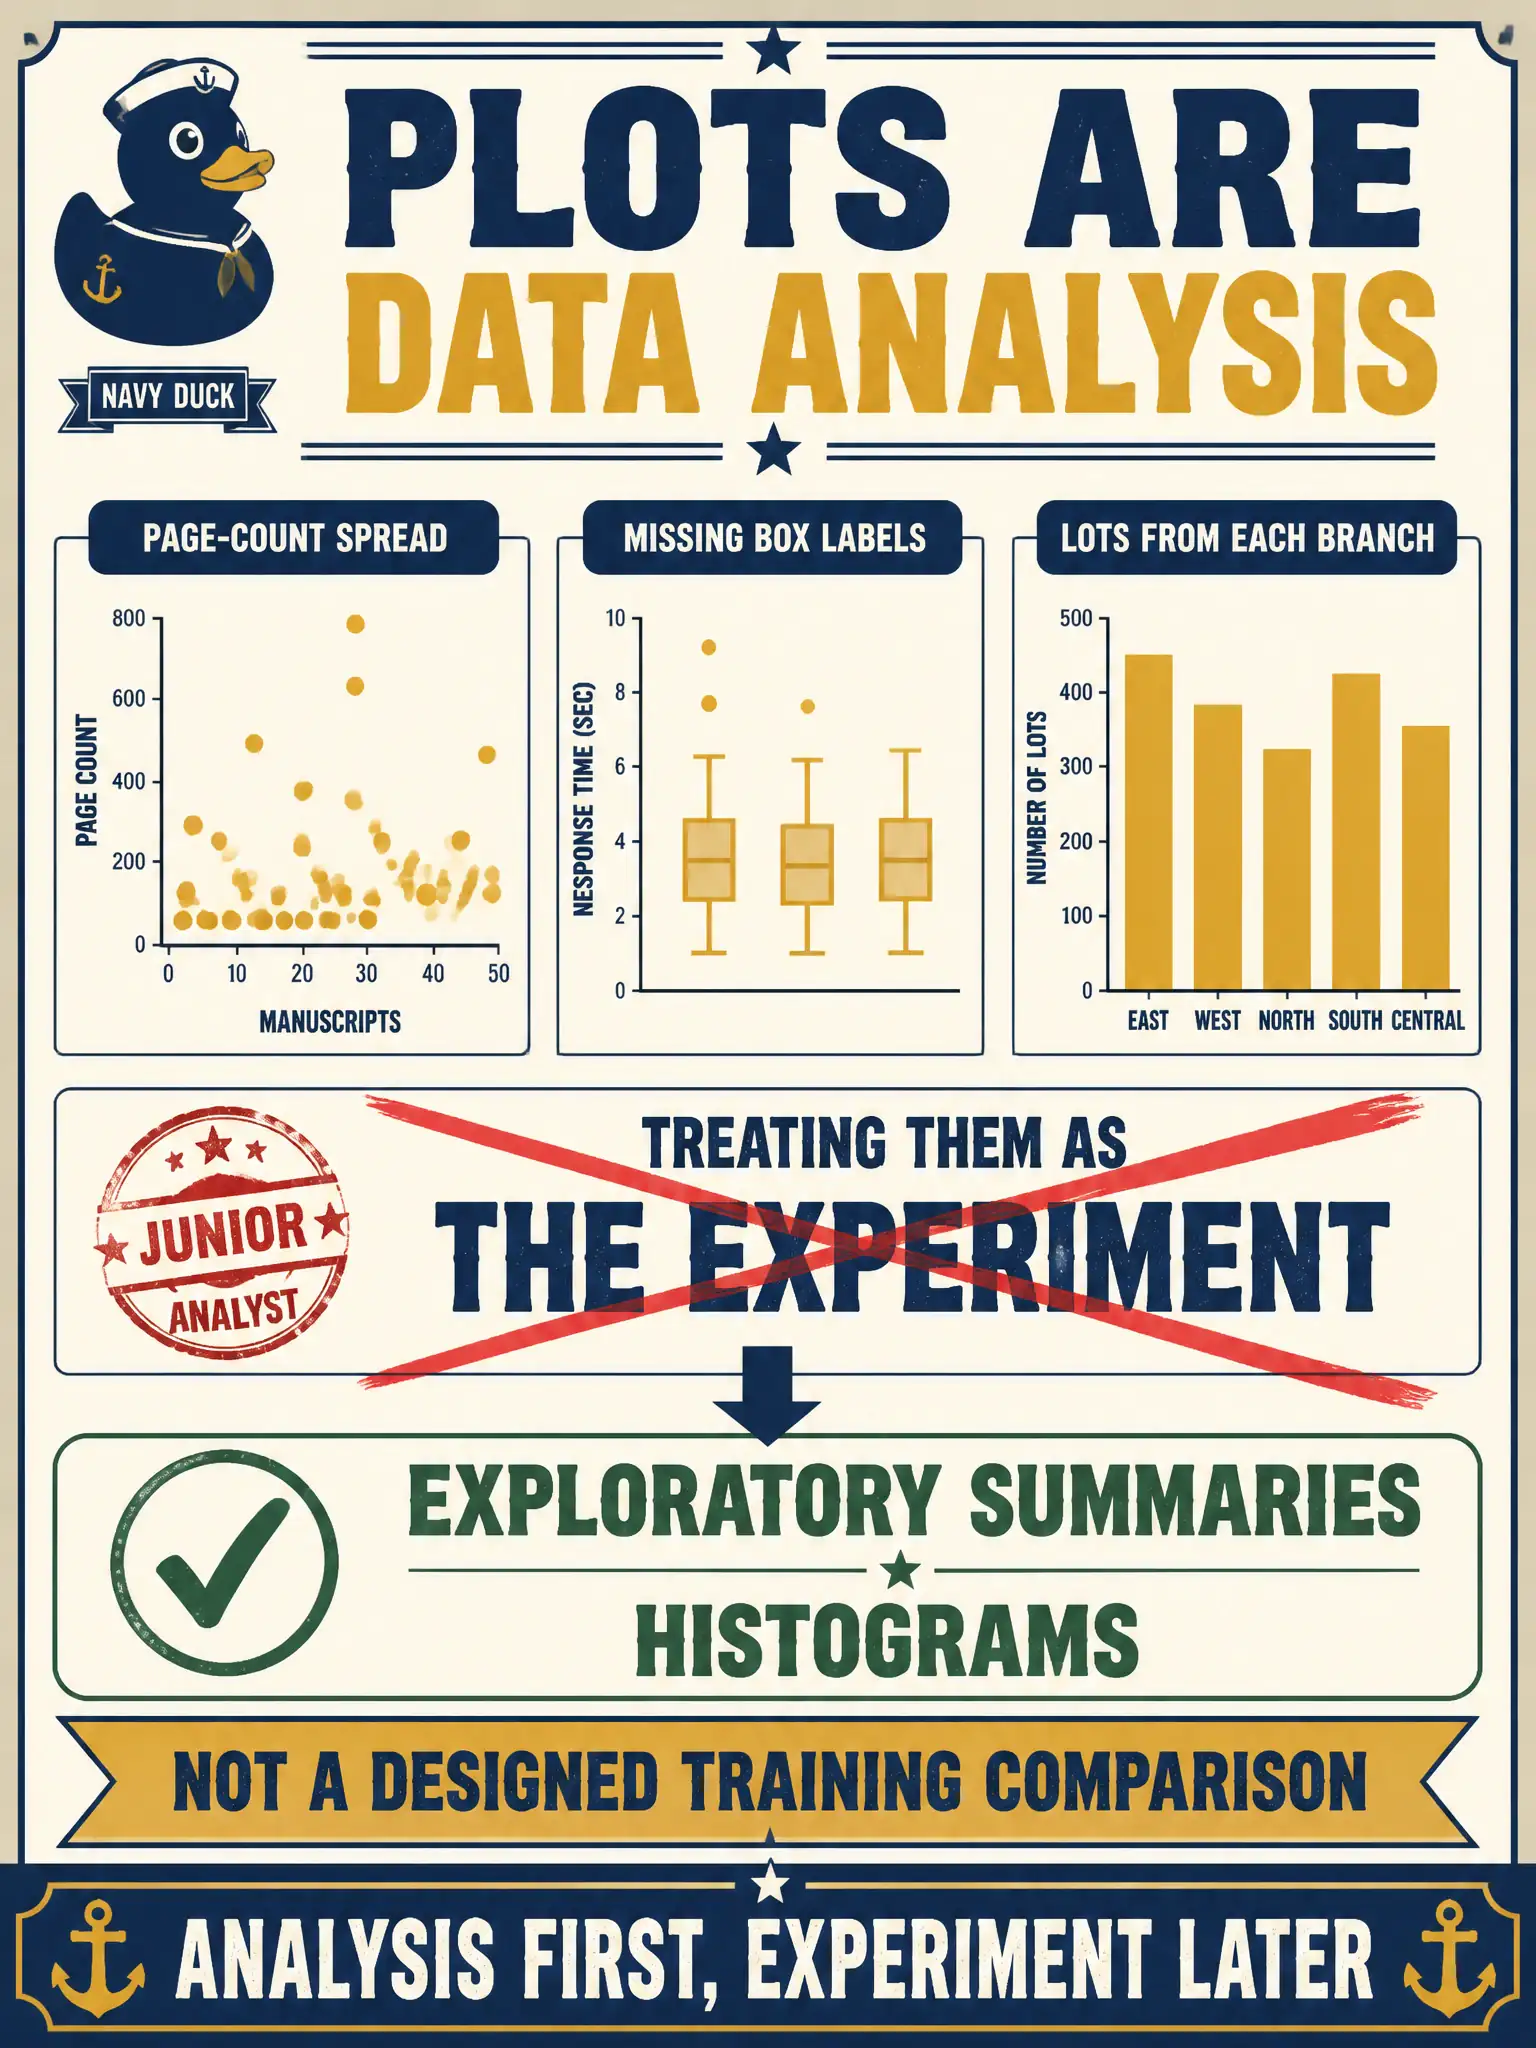
A city-archives desk wants page-count spread, missing box labels, and how many lots came from each branch before anyone fine-tunes a model. A junior treats those plots as the experiment. What are the plots?
Select an answer to reveal the explanation.
Short Explanation
Page-count spread, missing box labels, lots per branch. Those plots are exploratory data analysis, not a designed training comparison. They are not a train/val/test definition, not a PEFT run, and not a NIM microservice.
Full Explanation
Summaries and histograms are Domain 4 exploratory analysis. They tell a desk what the corpus looks like before anyone designs a training comparison. They are not a train/val/test definition, not a PEFT run, and not a serving package. Separate the EDA plots from a later experiment.