
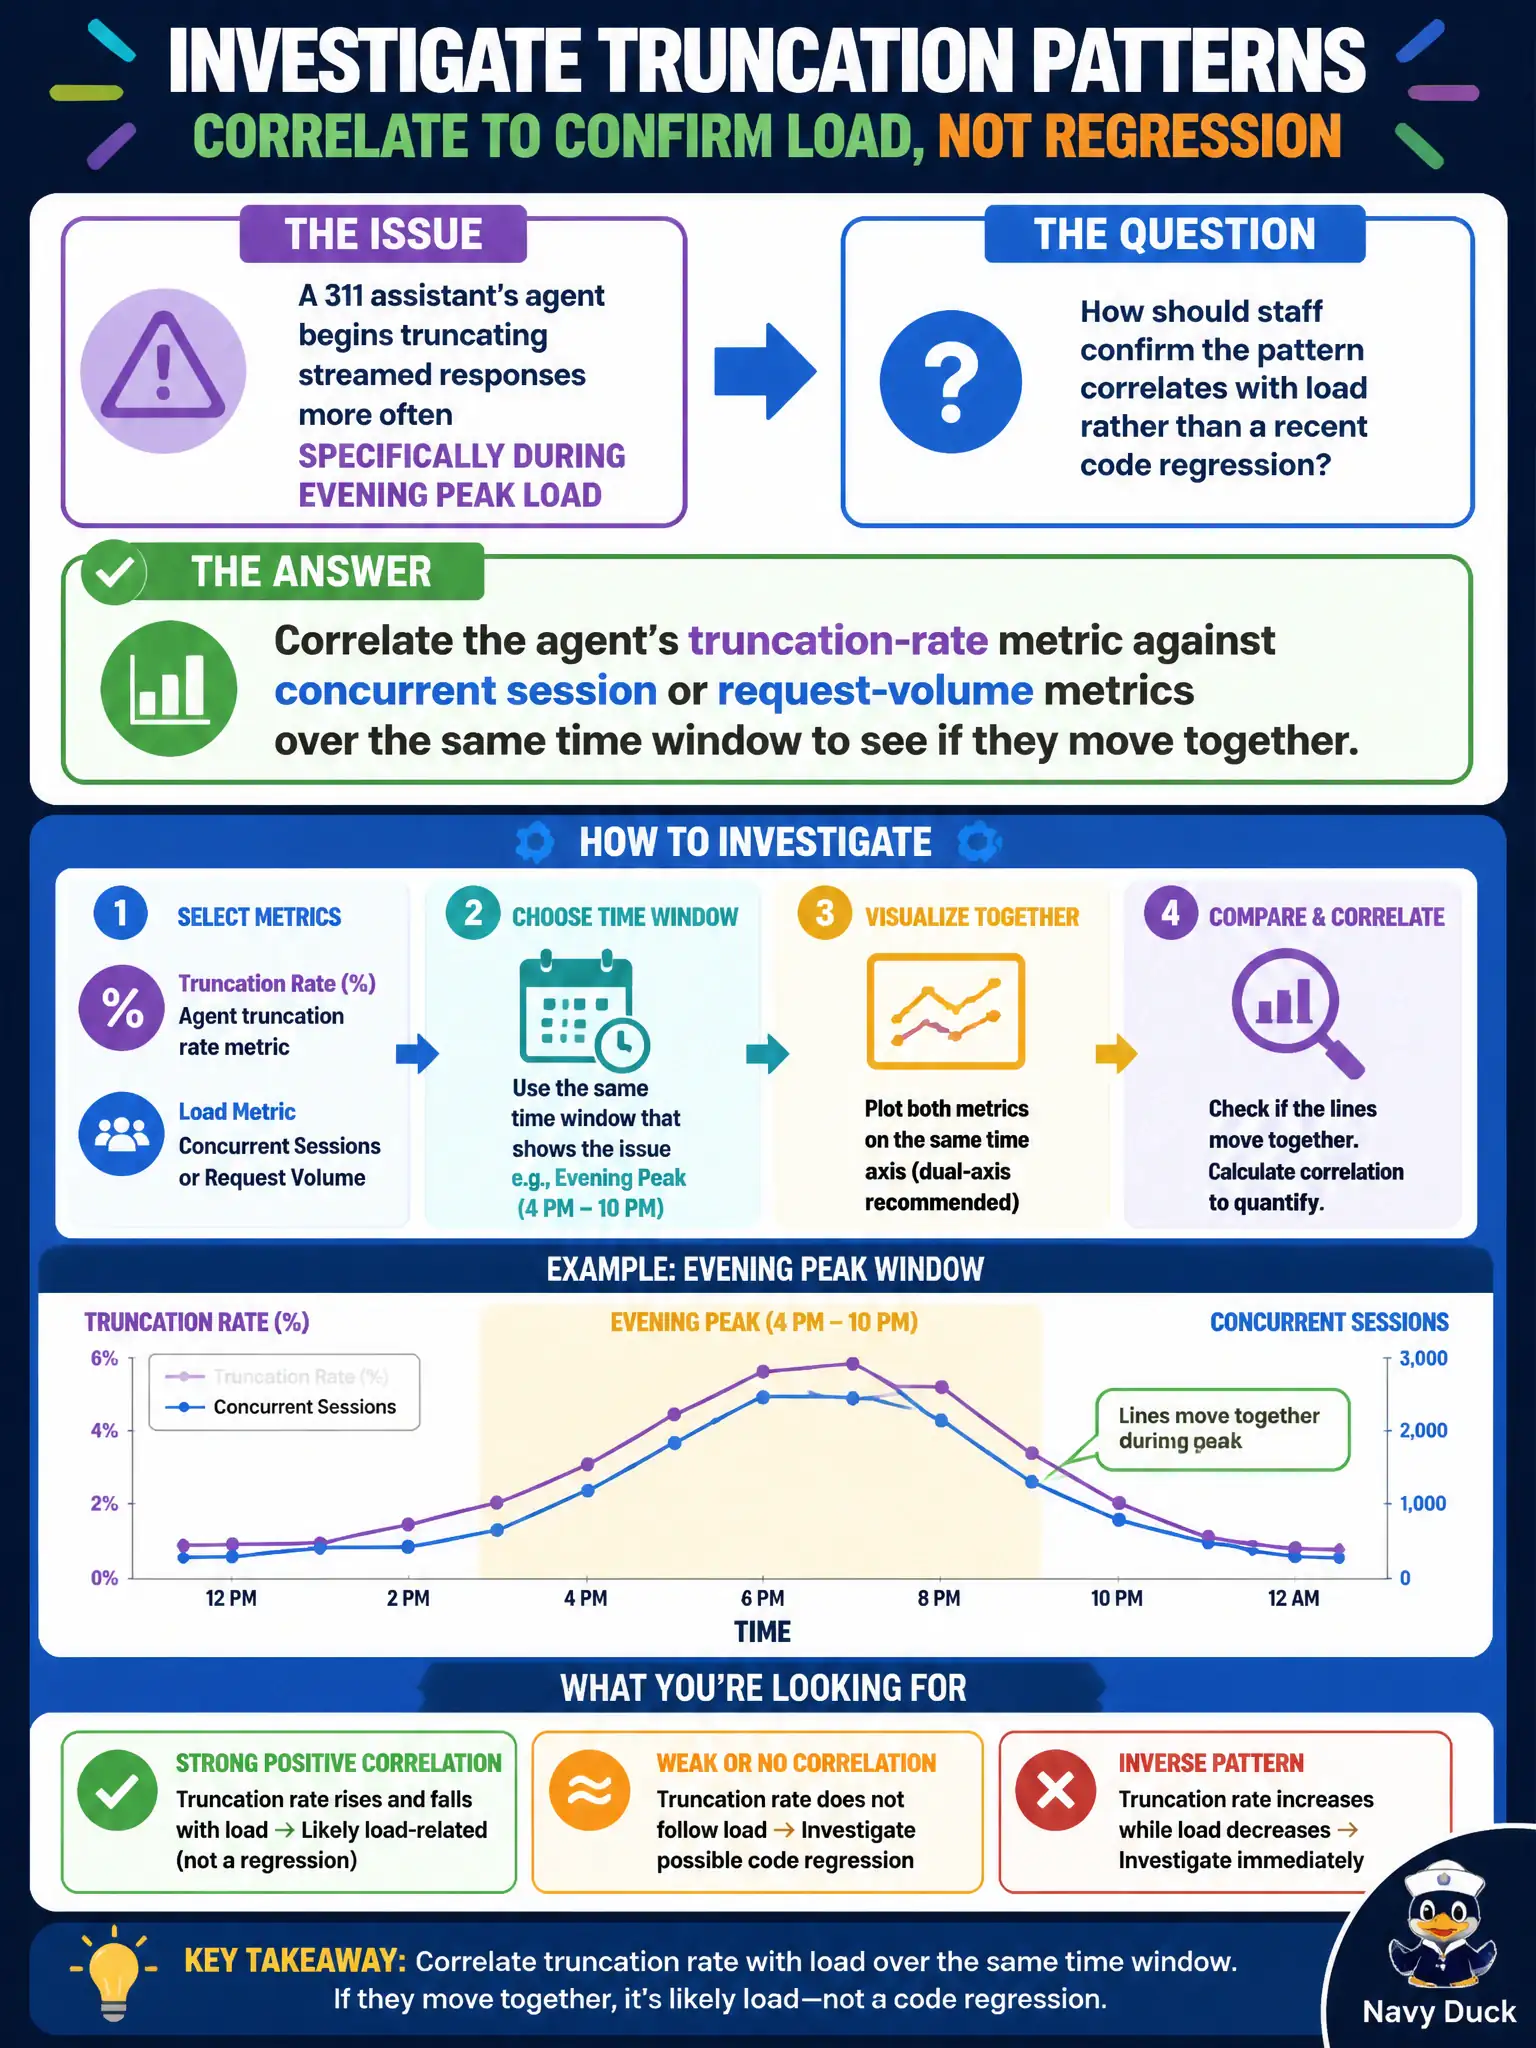
A 311 assistant's agent begins truncating streamed responses more often specifically during evening peak load, and staff need to confirm the pattern correlates with load rather than a recent code regression. How should they investigate?
Select an answer to reveal the explanation.
Short Explanation
Blaming the latest deploy the moment something looks off is a coin flip; you might be right, or you might roll back something innocent while the real cause is still there. Plotting the truncation-rate metric against concurrent session volume for the same time window either shows the two lines moving together or shows they don't. That's how you turn a hunch about peak load into an actual answer.
Full Explanation
Correlating the truncation-rate metric against a load metric like concurrent sessions over the same time window is a direct, evidence-based way to test the load hypothesis: if the two trends rise and fall together, load is implicated; if truncation spikes independent of load, something else, like a code change, is the more likely cause. Rolling back the latest deployment on the assumption that a new pattern must be a regression skips the investigation entirely and risks losing a legitimate fix while leaving a load-driven capacity issue unaddressed. Raising the token output limit might reduce truncation as a symptom, but it doesn't diagnose the cause and could increase cost and latency without confirming whether load was the actual driver. A resident satisfaction survey is slow, subjective, and depends on residents noticing and reporting the issue, a poor substitute for a direct metric correlation staff can pull immediately. Scope caveat: correlation across two metrics is suggestive, not conclusive, so a confirmed pattern should still be followed by checking for a plausible mechanism, such as throttling or timeout behavior under high concurrency. A concrete operational check: overlay the truncation-rate and concurrent-session charts for the same evening window and confirm whether the peaks align in time.