
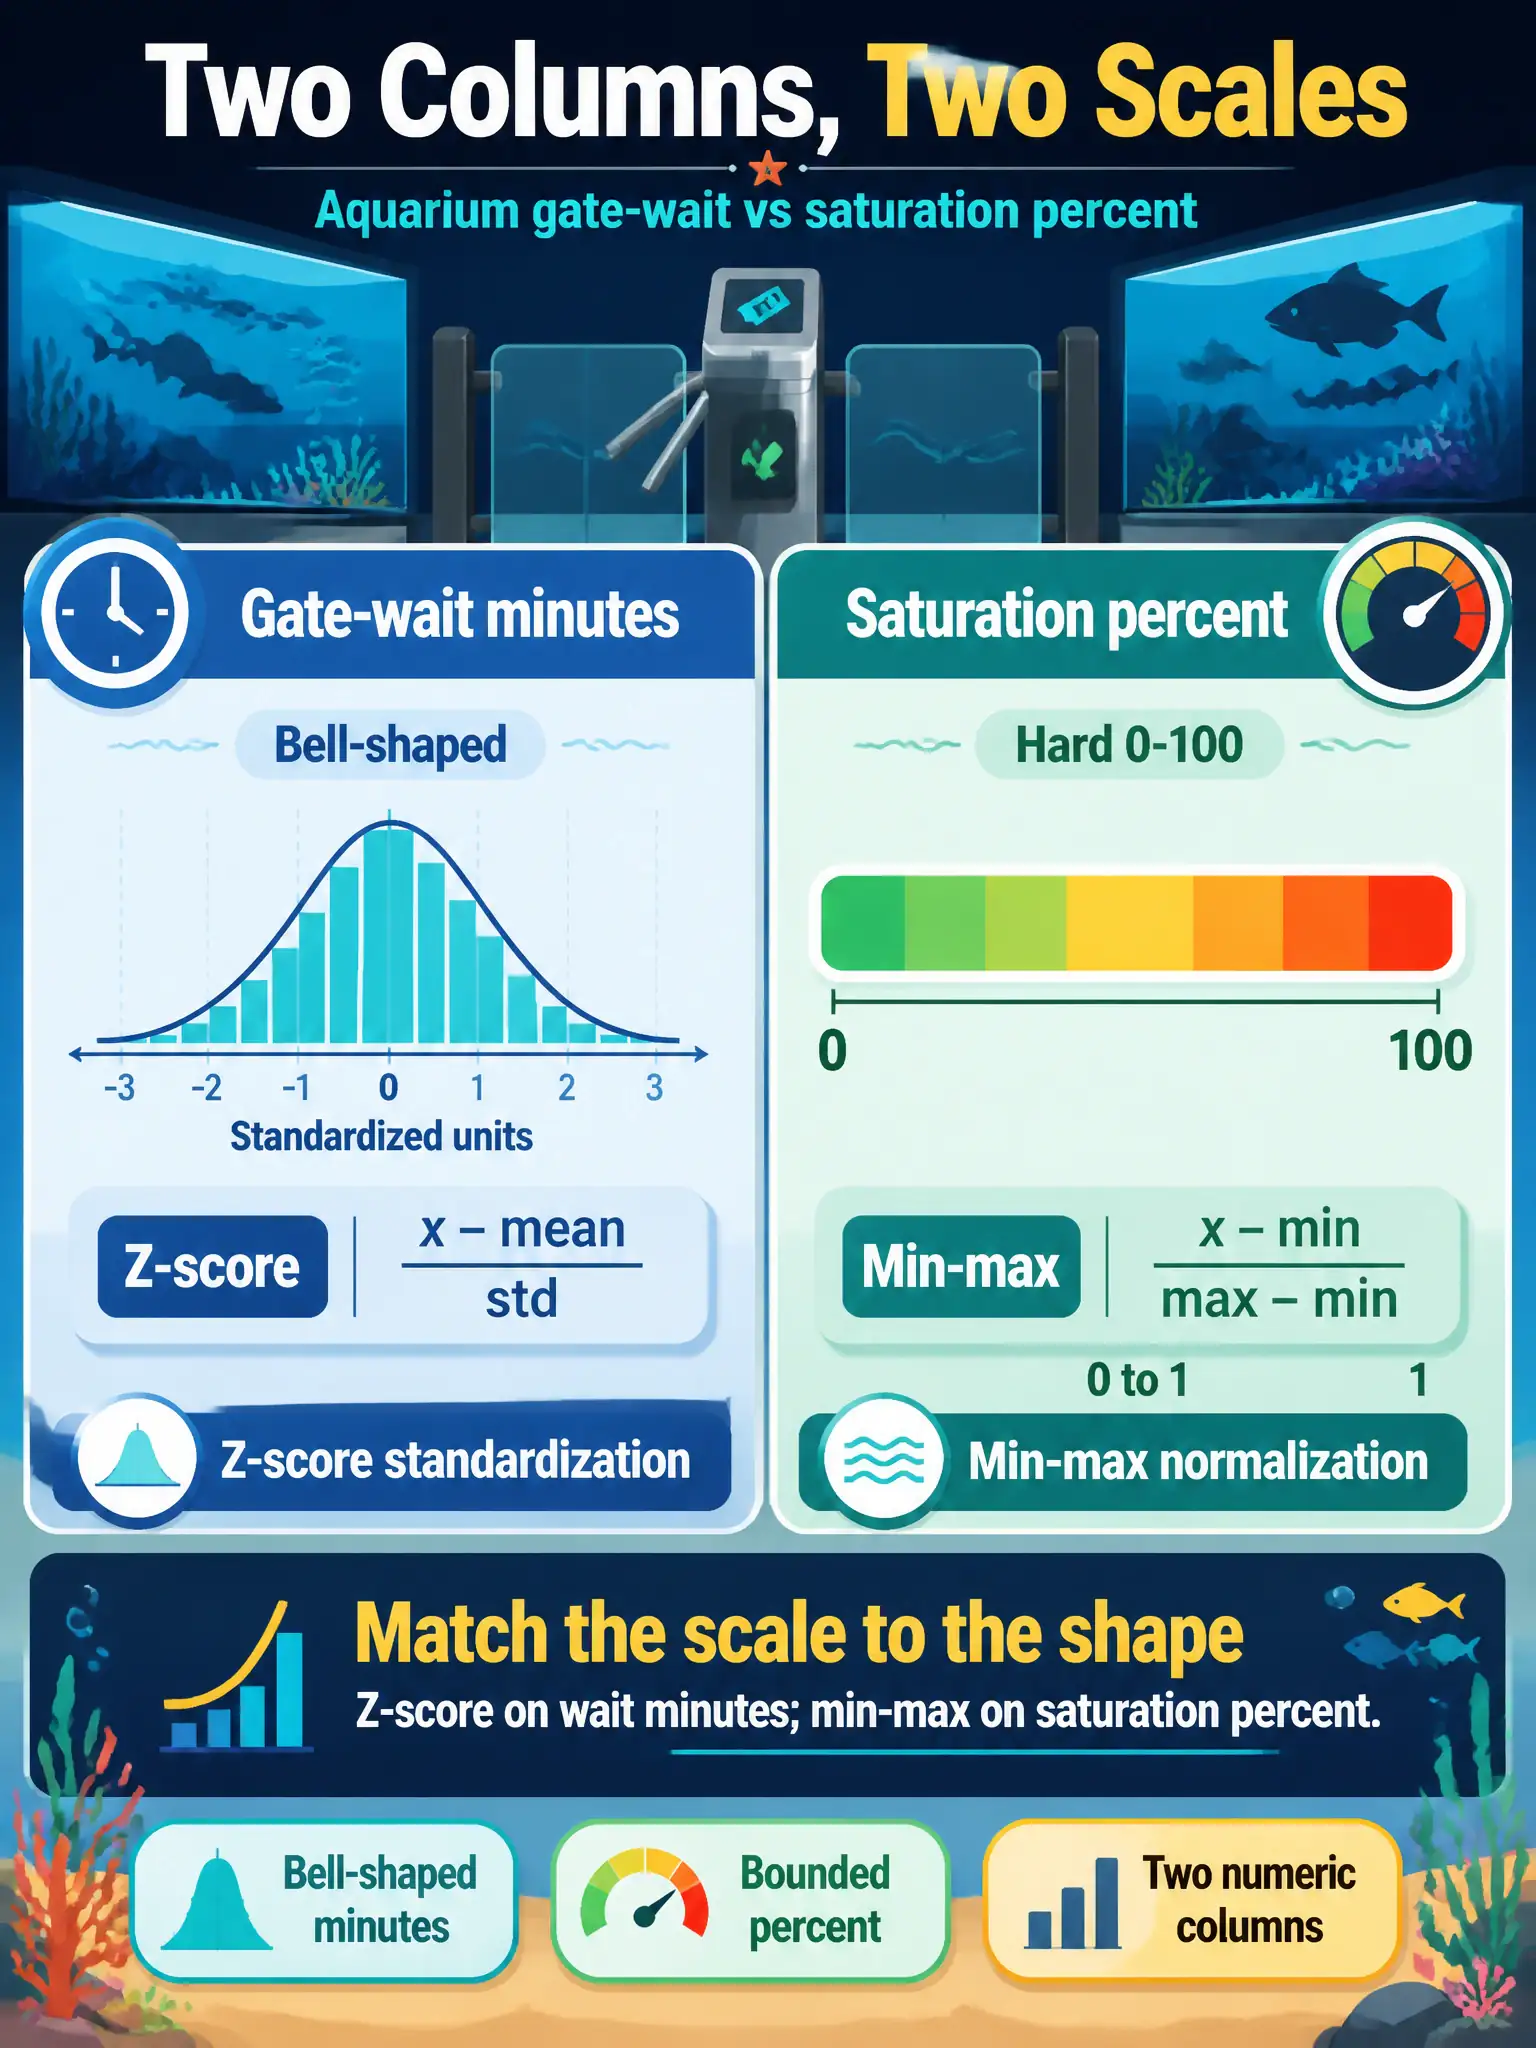
Aquarium gate-wait minutes are roughly bell-shaped; another column is a hard 0–100 saturation percent. How should those two numeric columns be scaled?
Select an answer to reveal the explanation.
Short Explanation
Think of bell-shaped wait minutes and a hard 0–100 saturation percent. Z-score the waits. Min-max the percent. Do not swap those names.
Full Explanation
Standardization is zero mean and unit variance, a fit for roughly bell-shaped waits. Min-max normalization maps a column into a bounded range, a fit for 0–100 saturation. Swapping those, skipping scale, and Firehose miss the pair.