
A security engineer needs to create a Microsoft Sentinel workbook that shows the geographic distribution of Azure OpenAI API calls over the past 7 days, highlighting calls from countries outside the expected usage regions. Which Microsoft Sentinel feature provides geographic visualization capabilities?
Select an answer to reveal the explanation.
Short Explanation
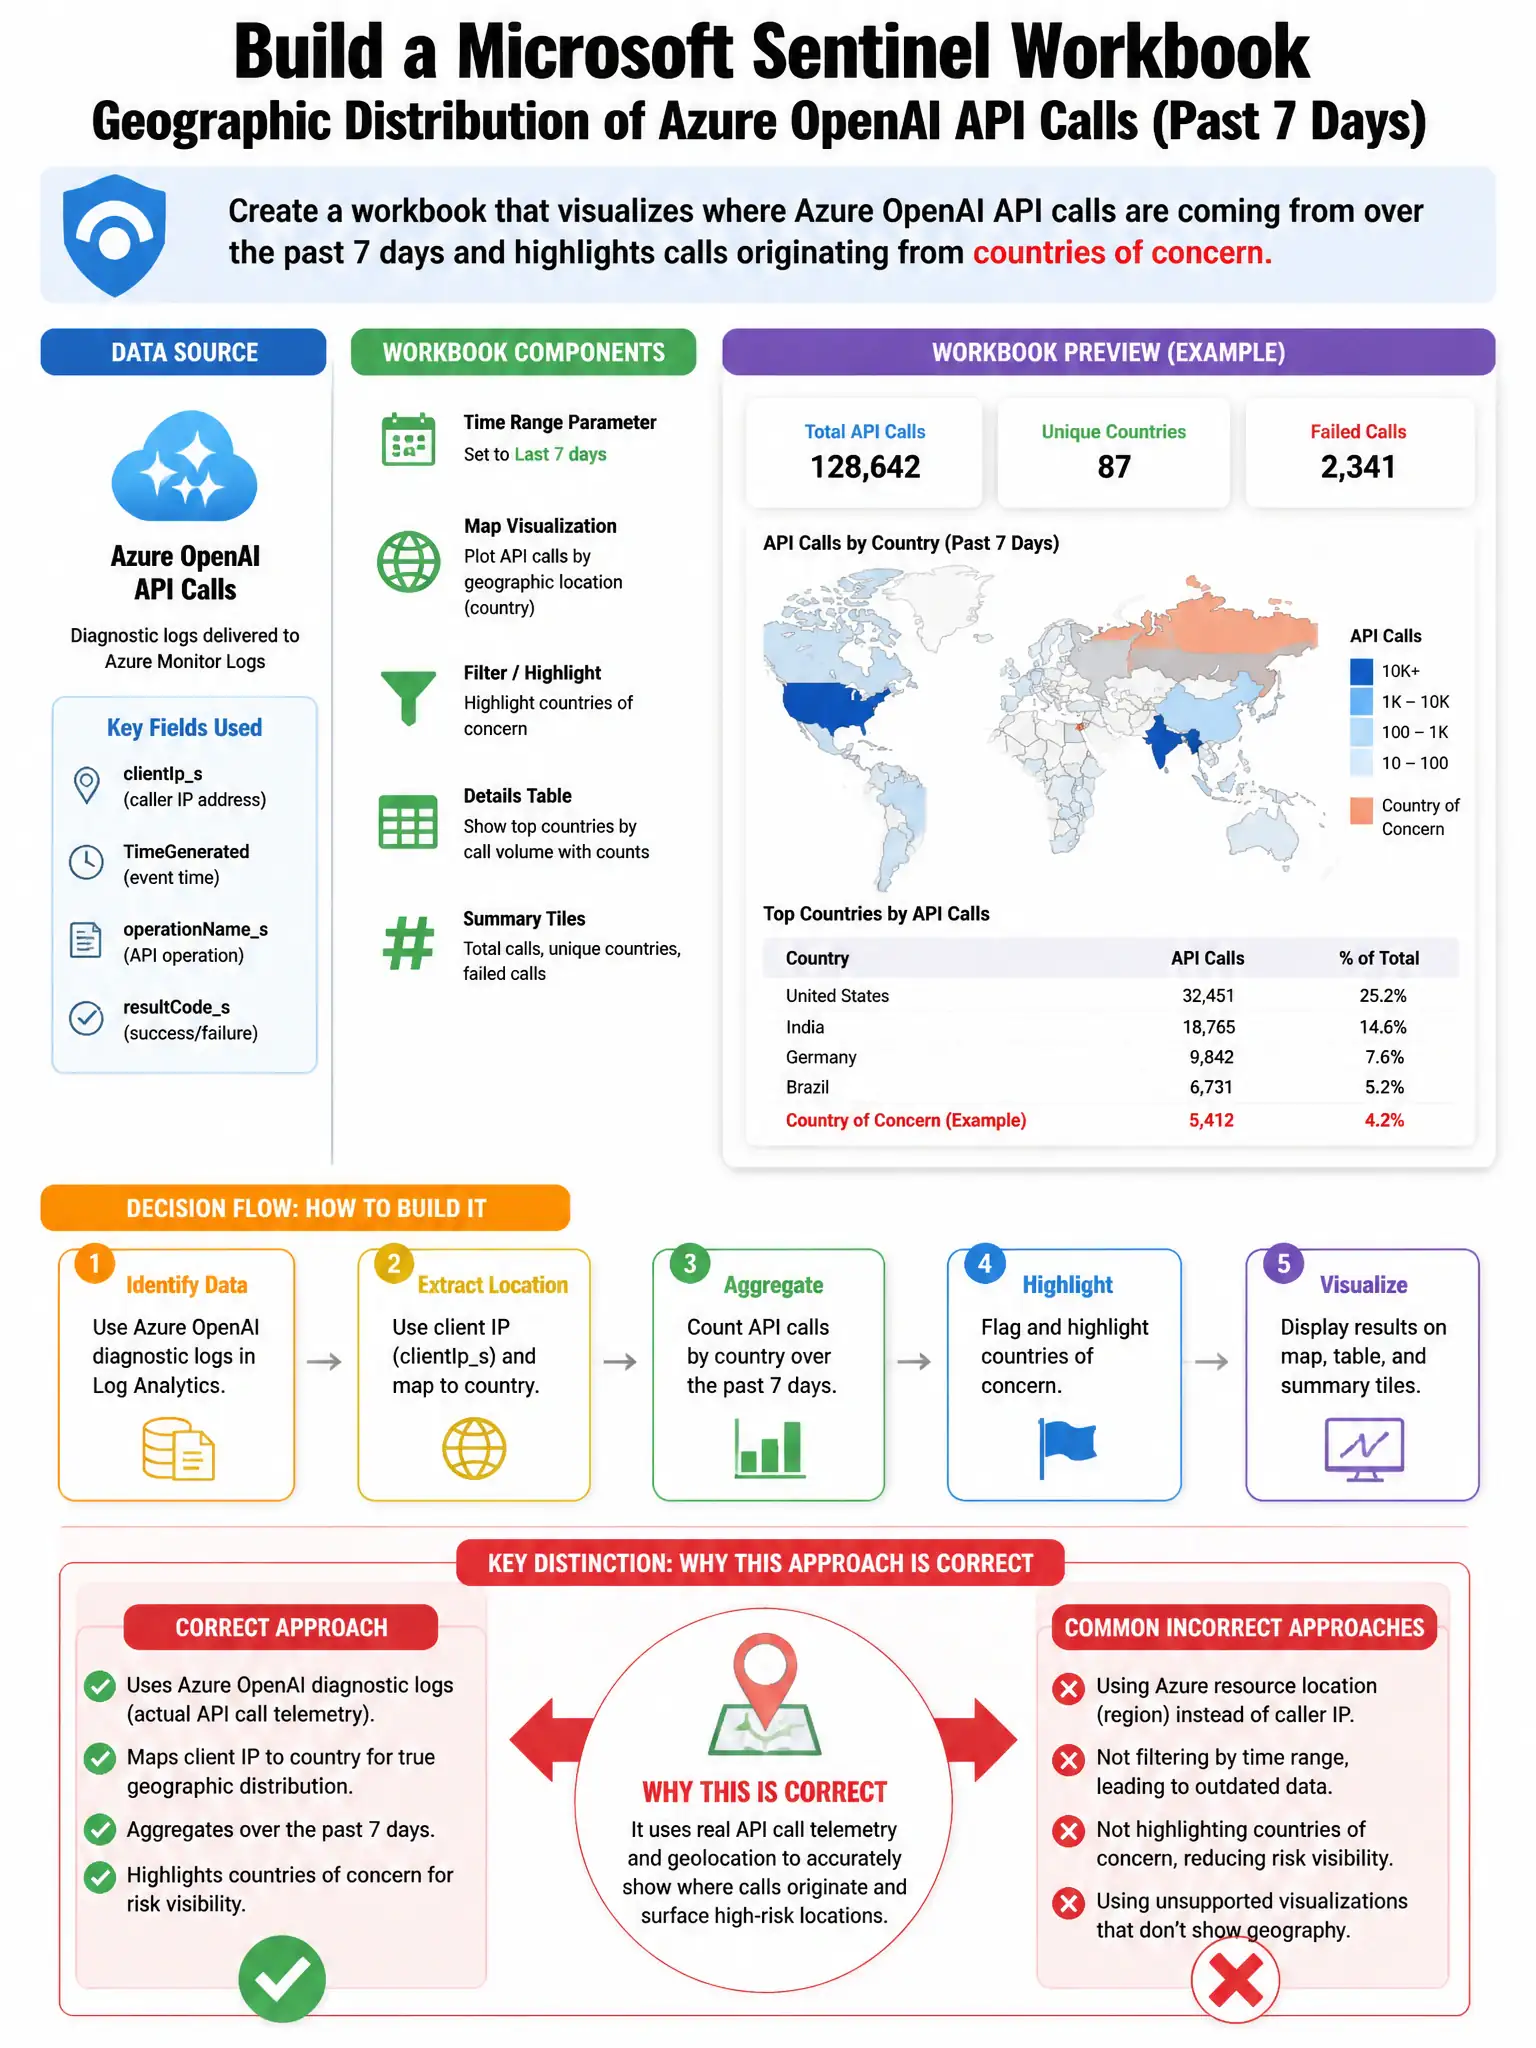
Here's the deal — you want Microsoft Sentinel Workbooks with the Azure Monitor Workbooks map visualization component. It plots Azure OpenAI API calls from AzureDiagnostics logs using latitude and longitude, so you can see where calls come from and spot unexpected countries.
Full Explanation
The correct choice is Microsoft Sentinel Workbooks with the Azure Monitor Workbooks map visualization component using latitude/longitude from AzureDiagnostics logs. Microsoft Sentinel Workbooks, built on Azure Monitor Workbooks, support map visualization components that can plot geographic data. By querying AzureDiagnostics logs for Azure OpenAI API calls and extracting or resolving the caller IP to geographic coordinates, engineers can create a map visualization showing the distribution of API calls by region and highlight outliers from unexpected countries. The Fusion ML option is incorrect because Fusion ML correlates alerts for high-fidelity incident detection; it does not provide workbook visualization components for geographic data. The Defender XDR advanced hunting map visualization with geographic filters option is incorrect because Defender XDR advanced hunting is a separate query interface and does not have a map visualization for geographic API call distribution. The Threat Intelligence map showing countries associated with known threat actors option is incorrect because the Threat Intelligence map shows threat actor-associated countries from TI feeds, not actual Azure OpenAI API call geography from diagnostic logs.