
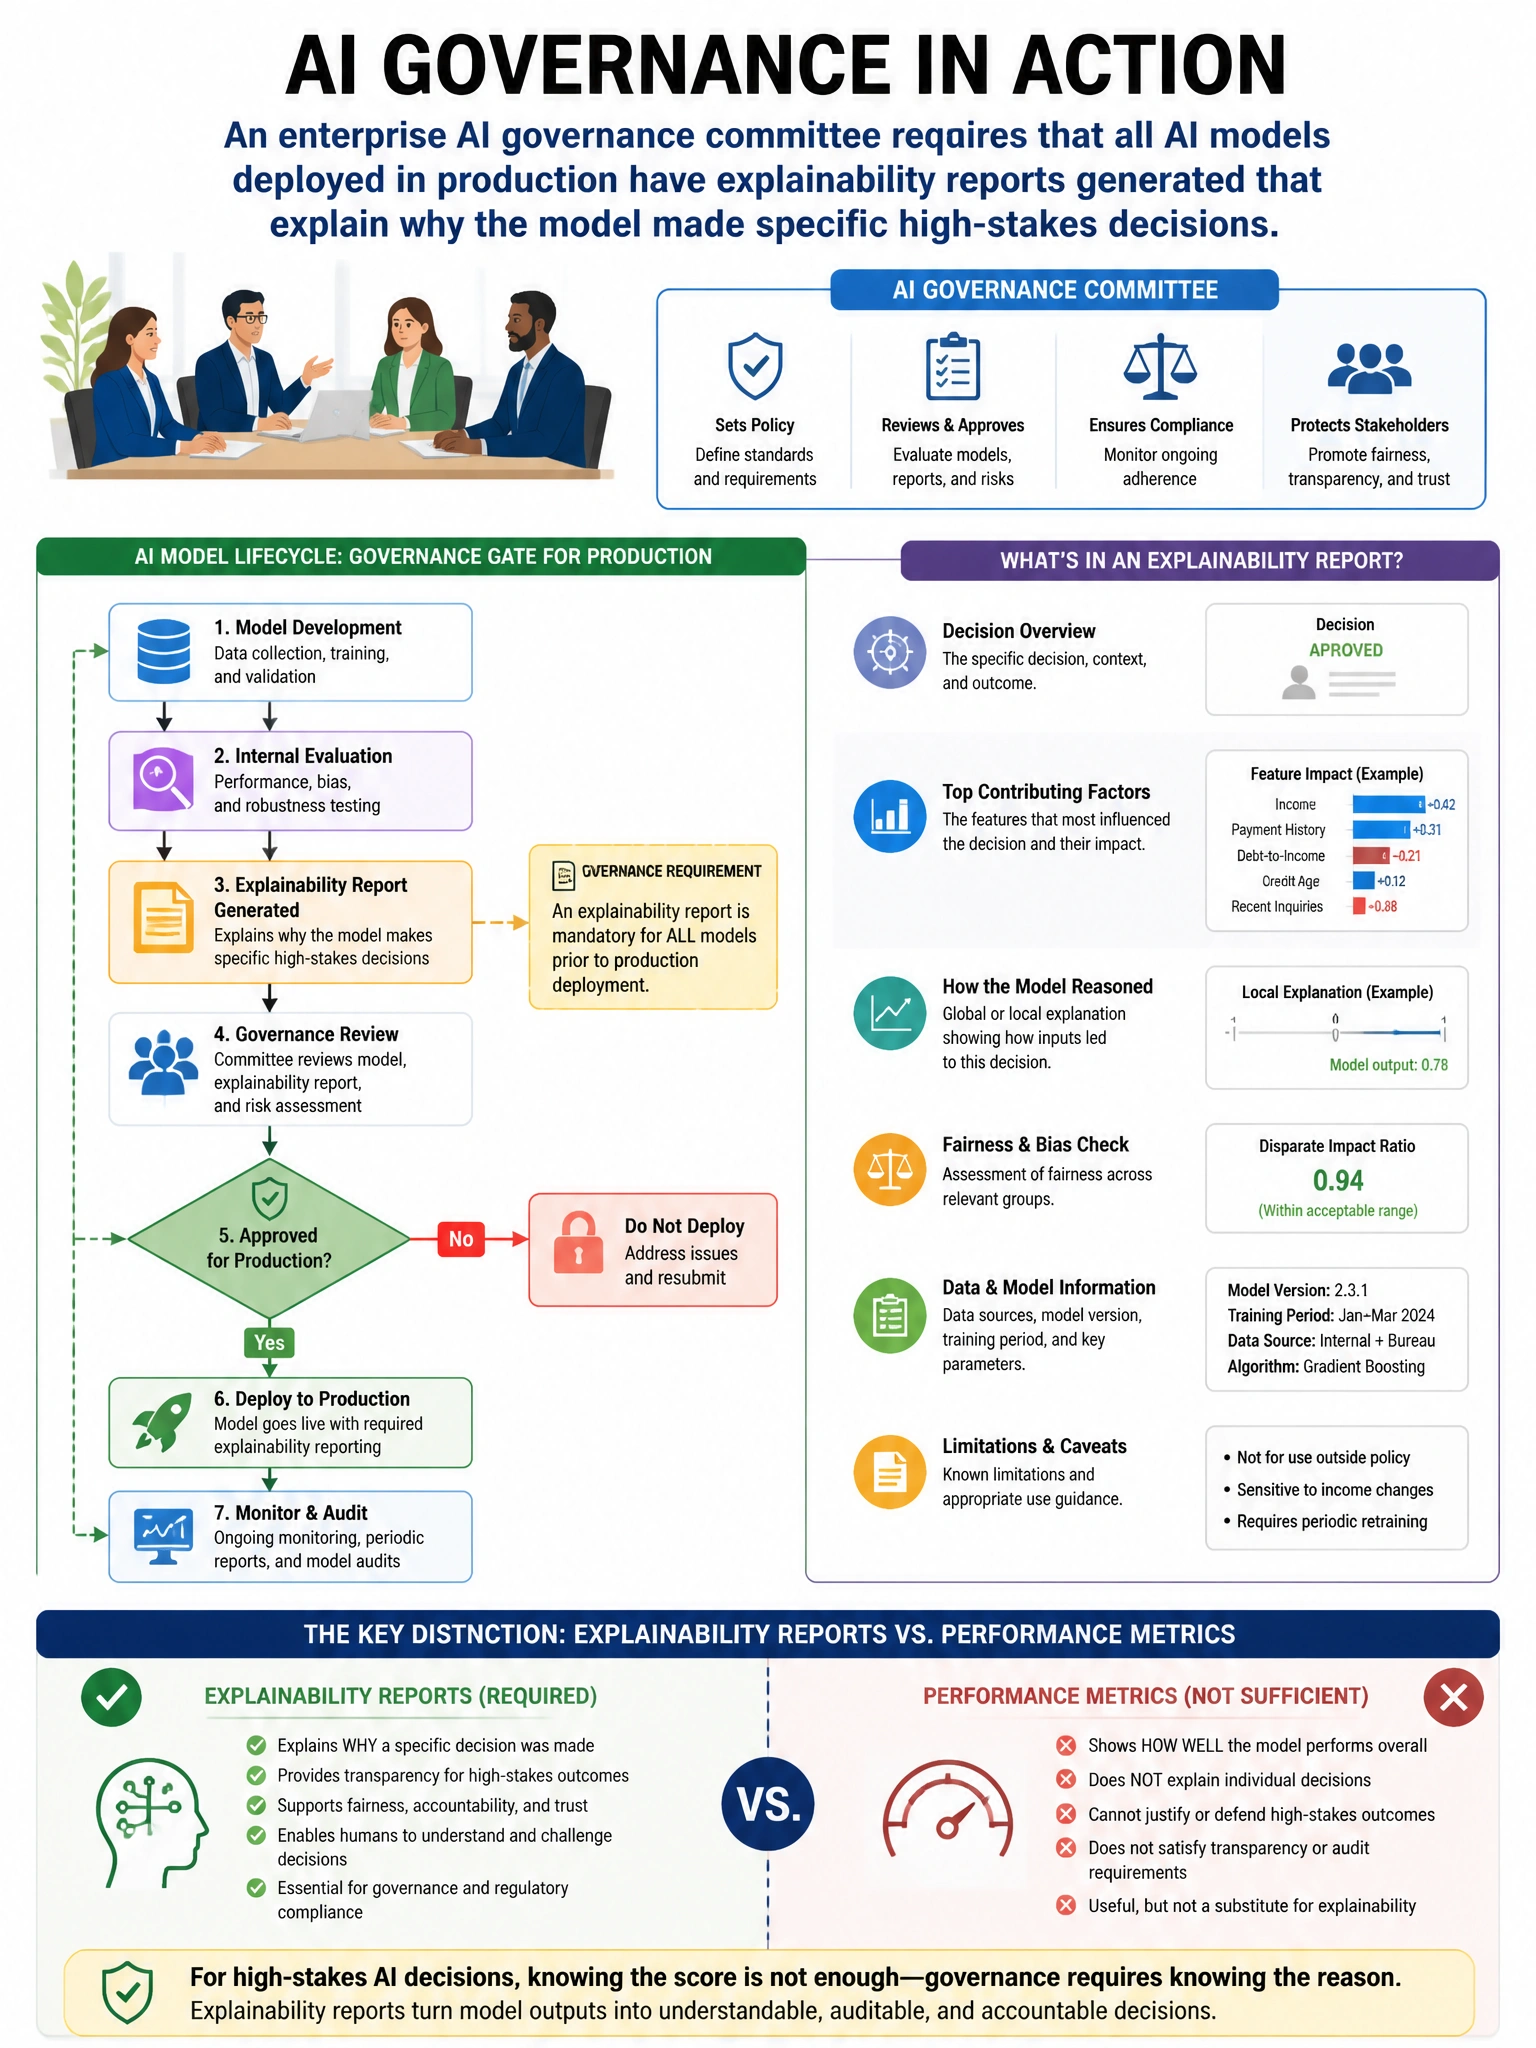
An enterprise AI governance committee requires that all AI models deployed in production have explainability reports generated that explain why the model made specific high-stakes decisions (e.g., loan denial, hiring rejection). Which Azure Machine Learning capability generates these explanations?
Select an answer to reveal the explanation.
Short Explanation and Infographic
Here's the deal — a is correct because the Azure Machine Learning Responsible AI dashboard includes an explainability component that computes feature importance scores using techniques like SHAP (SHapley Additive exPlanations) and LIME (Local Interpretable Model-agnostic Explanations). These methods explain which input features had the greatest influence on specific predictions, enabling audit-ready explainability reports for high-stakes decisions.
Full explanation below image
Full Explanation
A is correct because the Azure Machine Learning Responsible AI dashboard includes an explainability component that computes feature importance scores using techniques like SHAP (SHapley Additive exPlanations) and LIME (Local Interpretable Model-agnostic Explanations). These methods explain which input features had the greatest influence on specific predictions, enabling audit-ready explainability reports for high-stakes decisions. SHAP values specifically show the contribution of each feature to the model's output for individual predictions. B is wrong because AutoML model comparison charts compare model performance metrics (accuracy, AUC) across different algorithm choices; they do not explain individual predictions. C is wrong because the Purview Data Map lineage graph shows data flow from source to model, not why the model made a specific prediction. D is wrong because Application Insights tracks API-level metrics (latency, error rates) for the deployed model endpoint; it does not generate prediction-level explanations.