
Transit BI needs dashboards that stay fast during rush reporting on hourly boardings. Which Unity Catalog object should they use for pre-aggregated metrics?
Select an answer to reveal the explanation.
Short Explanation
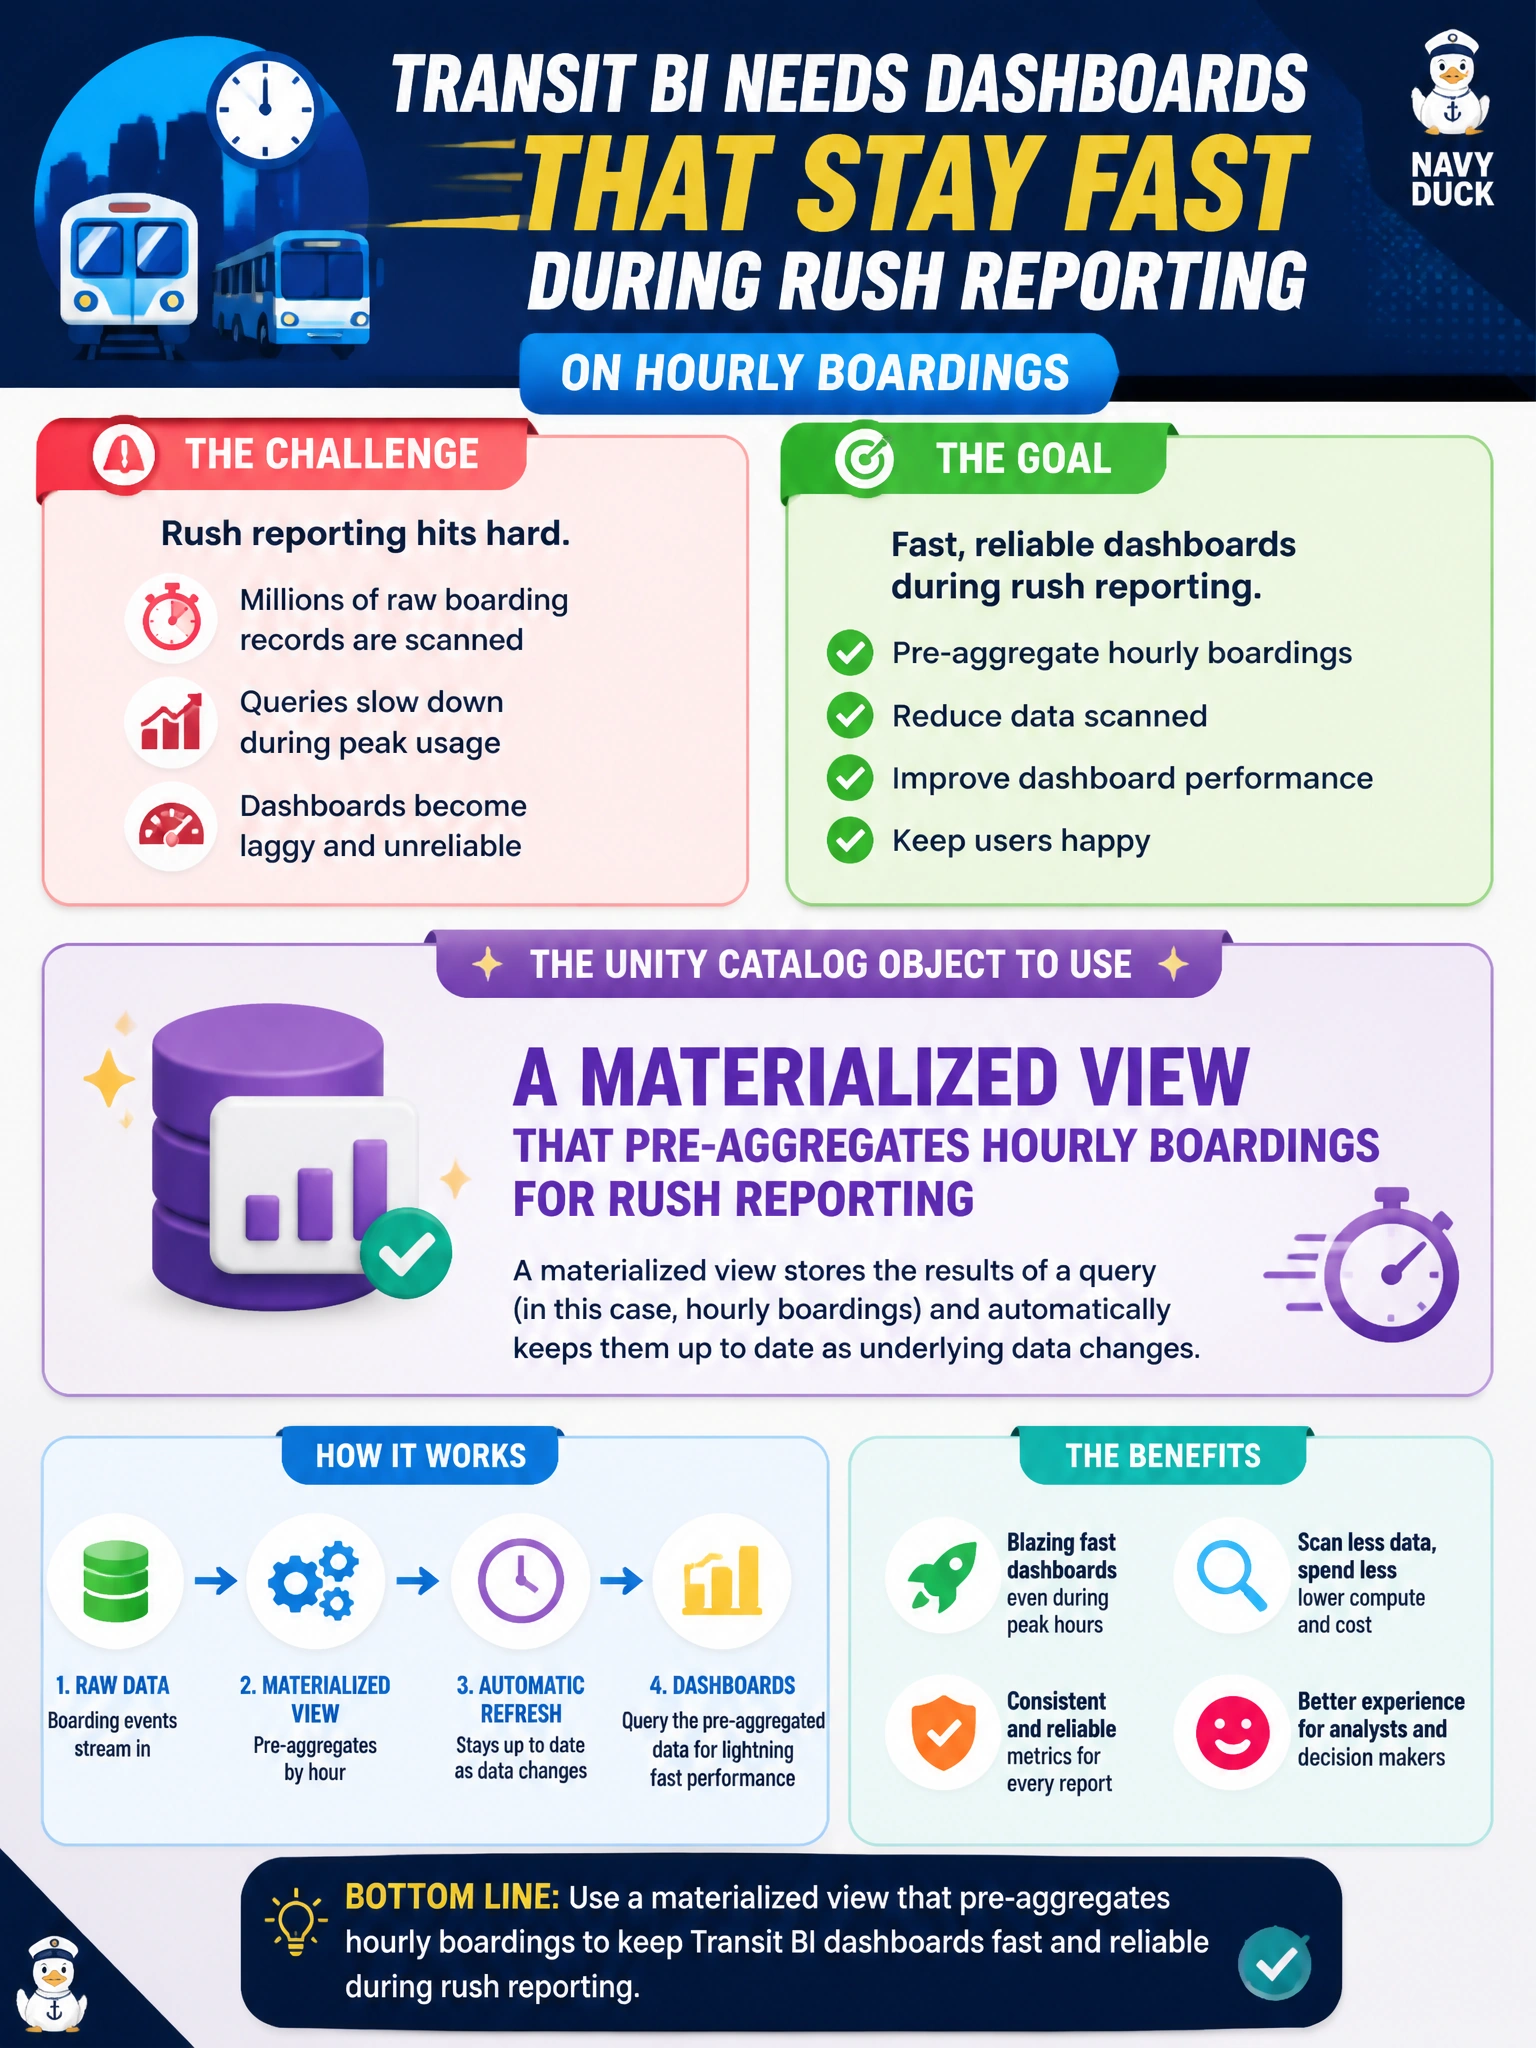
A materialized view is the pre-cooked rush-hour summary—hourly boardings already rolled up so dashboards do not re-chew raw fare dumps every click. An external table, a standard view, or a volume that says it pre-aggregates still leaves you scanning or recomputing raw rows at query time, so you'll lose that rush-hour speed.
Full Explanation
Transit BI needing dashboards that stay fast during rush reporting on hourly boardings should use a materialized view that pre-aggregates hourly boardings for rush reporting. Materialized views store precomputed results so dashboards query rolled-up metrics instead of rescanning raw fare-card or boarding facts on every rush-hour refresh—improving latency and reducing warehouse load for municipal operations centers.
An external table that pre-aggregates hourly boardings for rush reporting cannot actually persist a precomputed rollup; it only maps to underlying files and still scans raw rows on every dashboard refresh, so it is slow and brittle for rush reporting. A standard view that pre-aggregates hourly boardings for rush reporting remains a logical definition that recomputes the aggregation on every read, so it cannot deliver the persisted, pre-aggregated performance a materialized view gives rush dashboards. A Unity Catalog volume that pre-aggregates hourly boardings for rush reporting is still just file storage with no compute engine; dashboards must scan and aggregate those files at query time instead of reading pre-aggregated metrics.
Exam caveat: materialized views vs standard views—standard views recompute on read; MVs persist precomputed results for performance. Do not be misled by pre-aggregates wording in the distractors; only the materialized view persists precomputed results for dashboards. Volumes remain correct for files but not as a substitute for aggregated BI datasets.
Operational check: define a UC materialized view aggregating hourly boardings, refresh per transit SLA, point rush dashboards at the MV via SQL warehouse, and compare query times against raw fact scans during peak reporting.
Prefer to study offline? Printable PDF study book + test engine ($7.50, unofficial). These questions stay free here.