
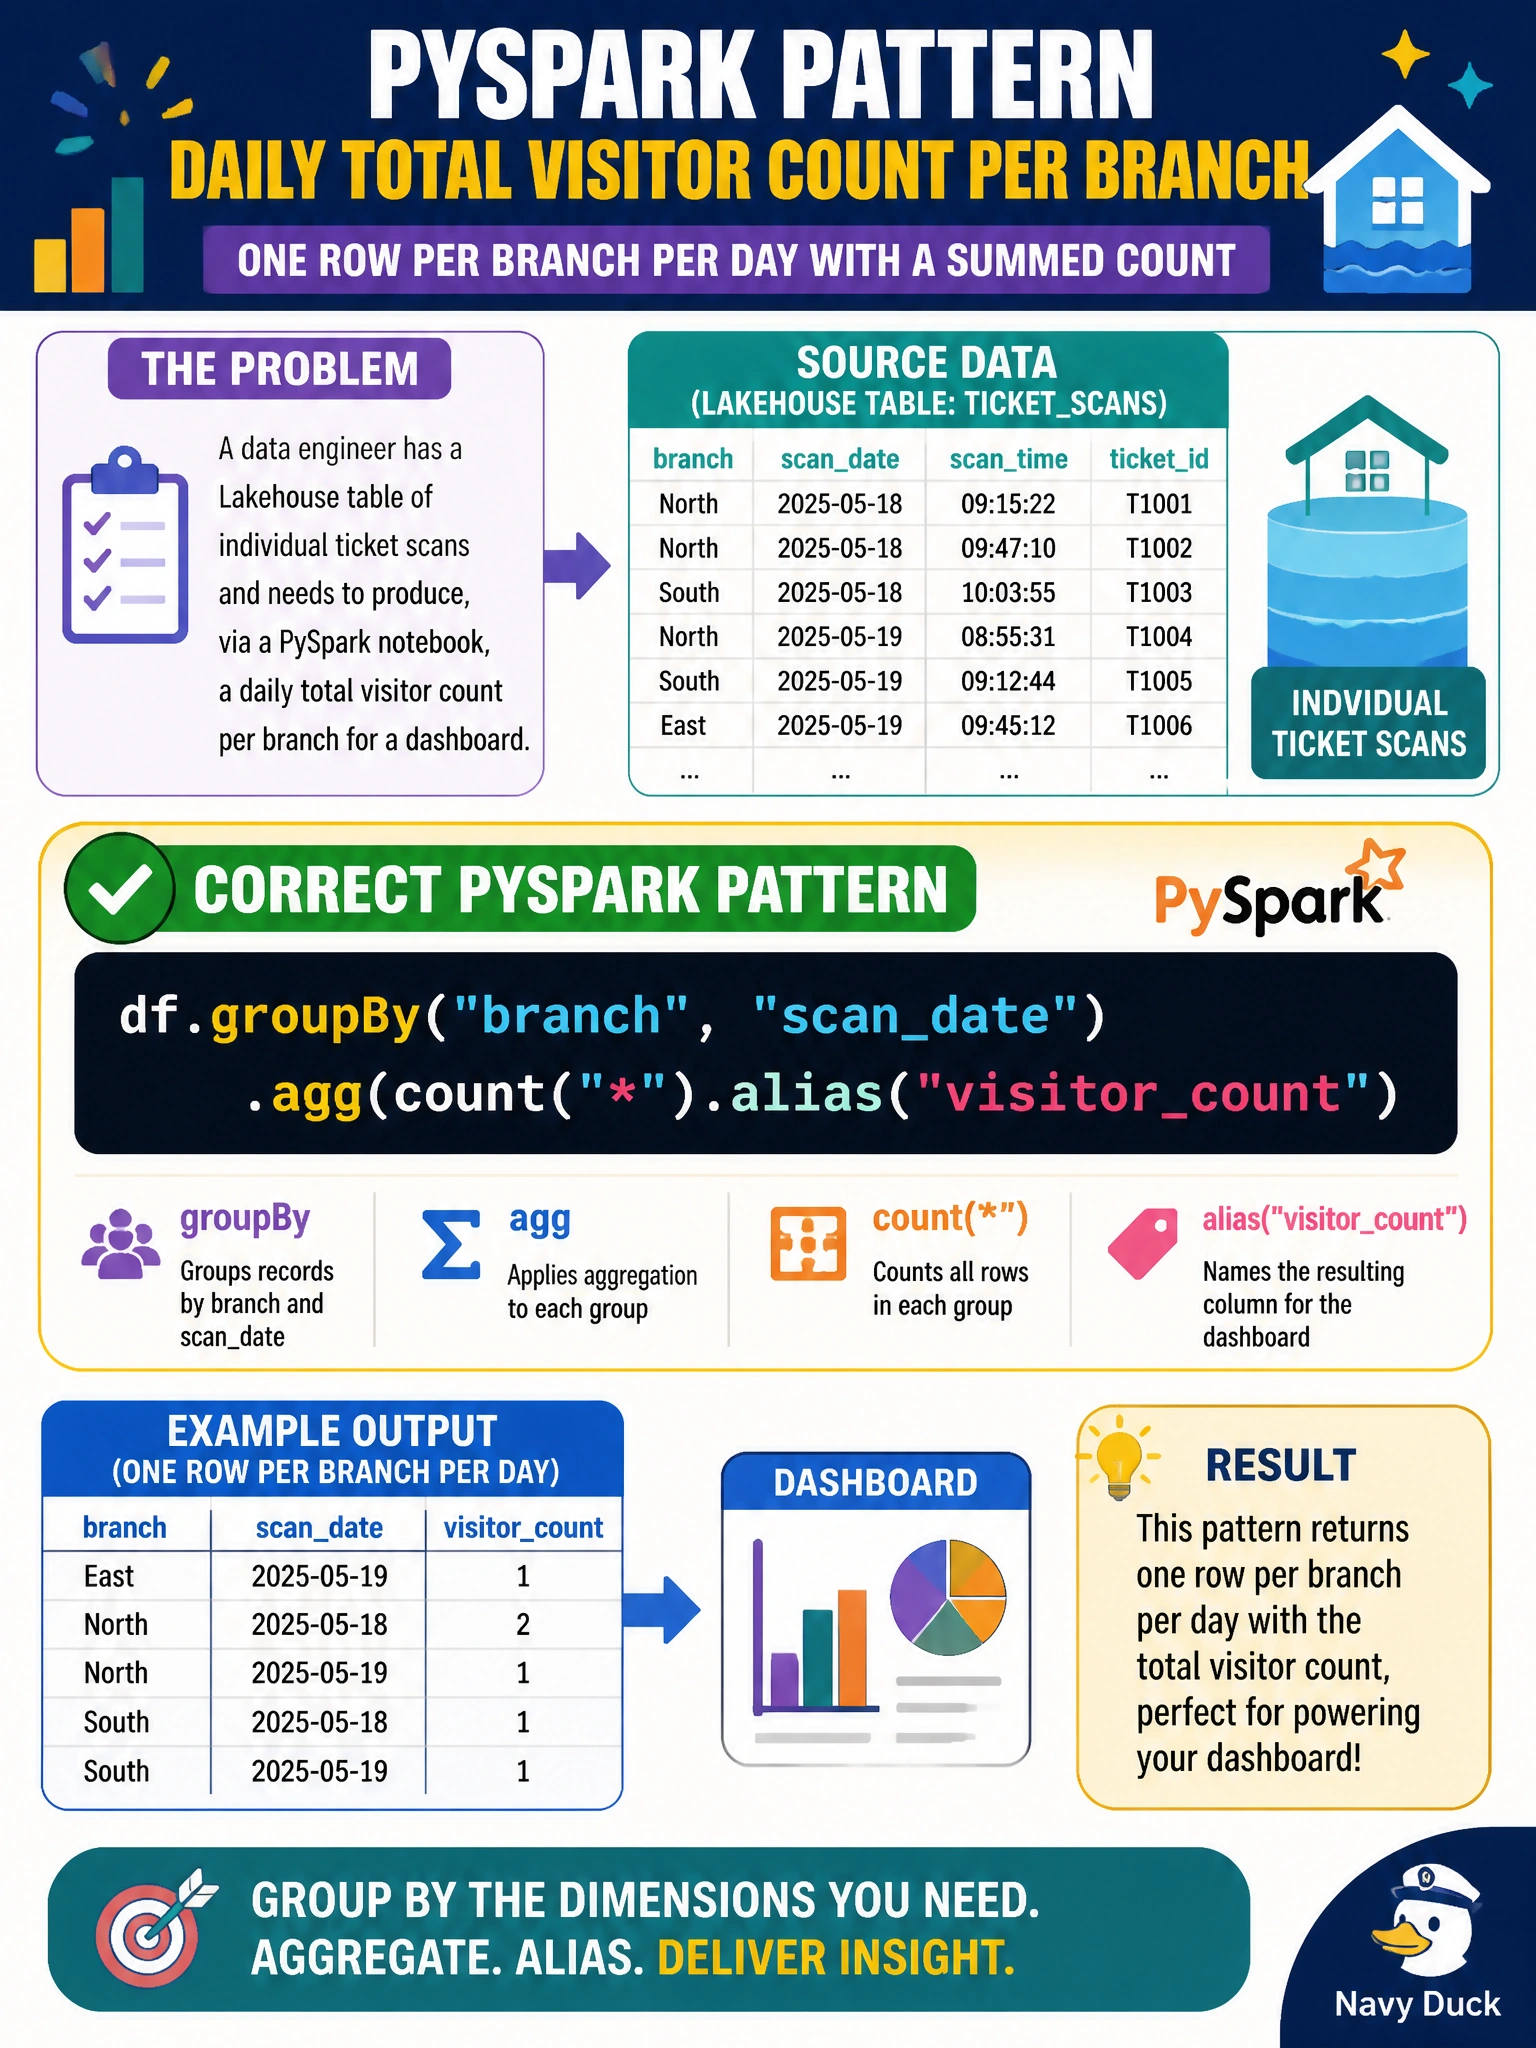
A data engineer has a Lakehouse table of individual ticket scans and needs to produce, via a PySpark notebook, a daily total visitor count per branch for a dashboard. Which PySpark pattern correctly produces one row per branch per day with a summed count?
Select an answer to reveal the explanation.
Short Explanation
Think of groupBy().agg() like sorting a pile of ticket stubs into labeled bins by branch and date, then counting how many stubs landed in each bin. That grouped count is exactly what turns raw scans into a per-branch, per-day total.
Full Explanation
groupBy("branch", "scan_date") partitions the DataFrame's rows into buckets sharing the same branch and date, and the paired agg(count("*")) then counts the rows in each bucket, producing exactly one summarized row per branch per day — the standard PySpark pattern for turning granular event rows into a daily aggregate. orderBy only changes the row ordering of the existing granular data; it doesn't collapse anything into a summary, so the dashboard would still see one row per individual scan. select().distinct() removes duplicate branch-and-date combinations, but it discards the count entirely rather than computing one — the dashboard needs to know how many scans happened, not just which branch-and-date pairs exist. A plain filter for non-null branches is a data-quality step that has nothing to do with aggregation; it neither groups rows nor produces a count. Before trusting the daily totals, check whether any ticket scans lack a branch value and decide explicitly whether those should be excluded or bucketed separately, rather than silently dropped by the group-by.