
A multi-agent booking solution has a contractual SLA: 99.9% successful completion of the booking workflow within 45 seconds for interactive sessions. Platform CPU is healthy, but customers report timeouts when the orchestrator waits on a slow third-party MCP tool. What monitoring design addresses SLA adherence?
Select an answer to reveal the explanation.
Short Explanation
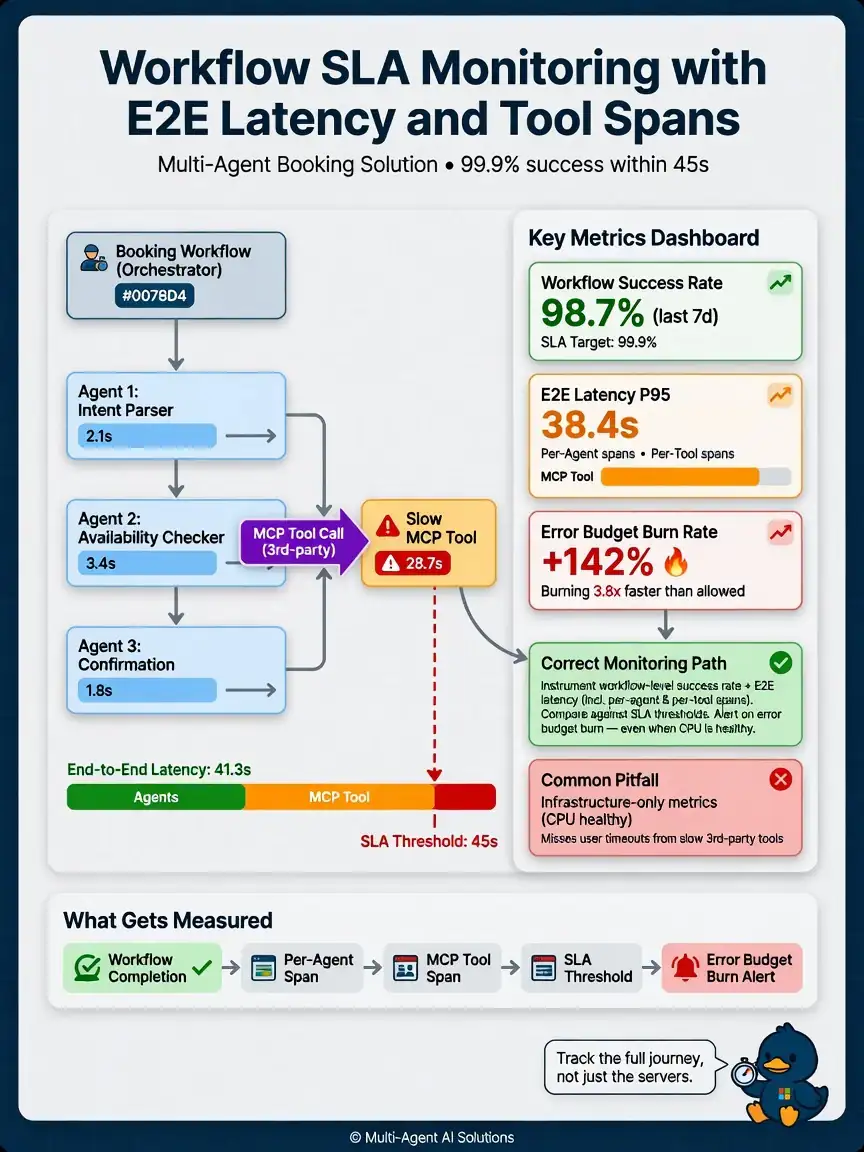
You need to watch the booking workflow itself, not just the VM. Track success rate and end-to-end latency with per-agent and per-tool spans, then alert when error-budget burn rises even if CPU looks fine.
Full Explanation
The correct design is to instrument workflow-level success rate and end-to-end latency, including per-agent and per-tool spans, compare against SLA thresholds, and alert when error-budget burn increases—even if infrastructure metrics look normal. Contractual workflow SLAs require end-to-end success and latency metrics with span-level breakdowns for agents and tools, plus alerting on error-budget burn—even when host metrics are healthy.
Tracking only VM CPU and memory, ignoring workflow-level latency and success ratios, is wrong because infrastructure metrics can be green while workflow SLA is red due to tool waits. Measuring only the model's tokens-per-second and treating that as the SLA is wrong because model throughput is not booking completion within 45 seconds. Disabling SLA dashboards because third-party tools are out of scope is wrong because dependencies that block the workflow affect customer SLA and must be monitored. Exam tip: Multi-agent SLA = workflow success + end-to-end latency, not CPU alone.