
A transit ridership model is live and delayed-trip labels arrive each week. What should the team track in production?
Select an answer to reveal the explanation.
Short Explanation
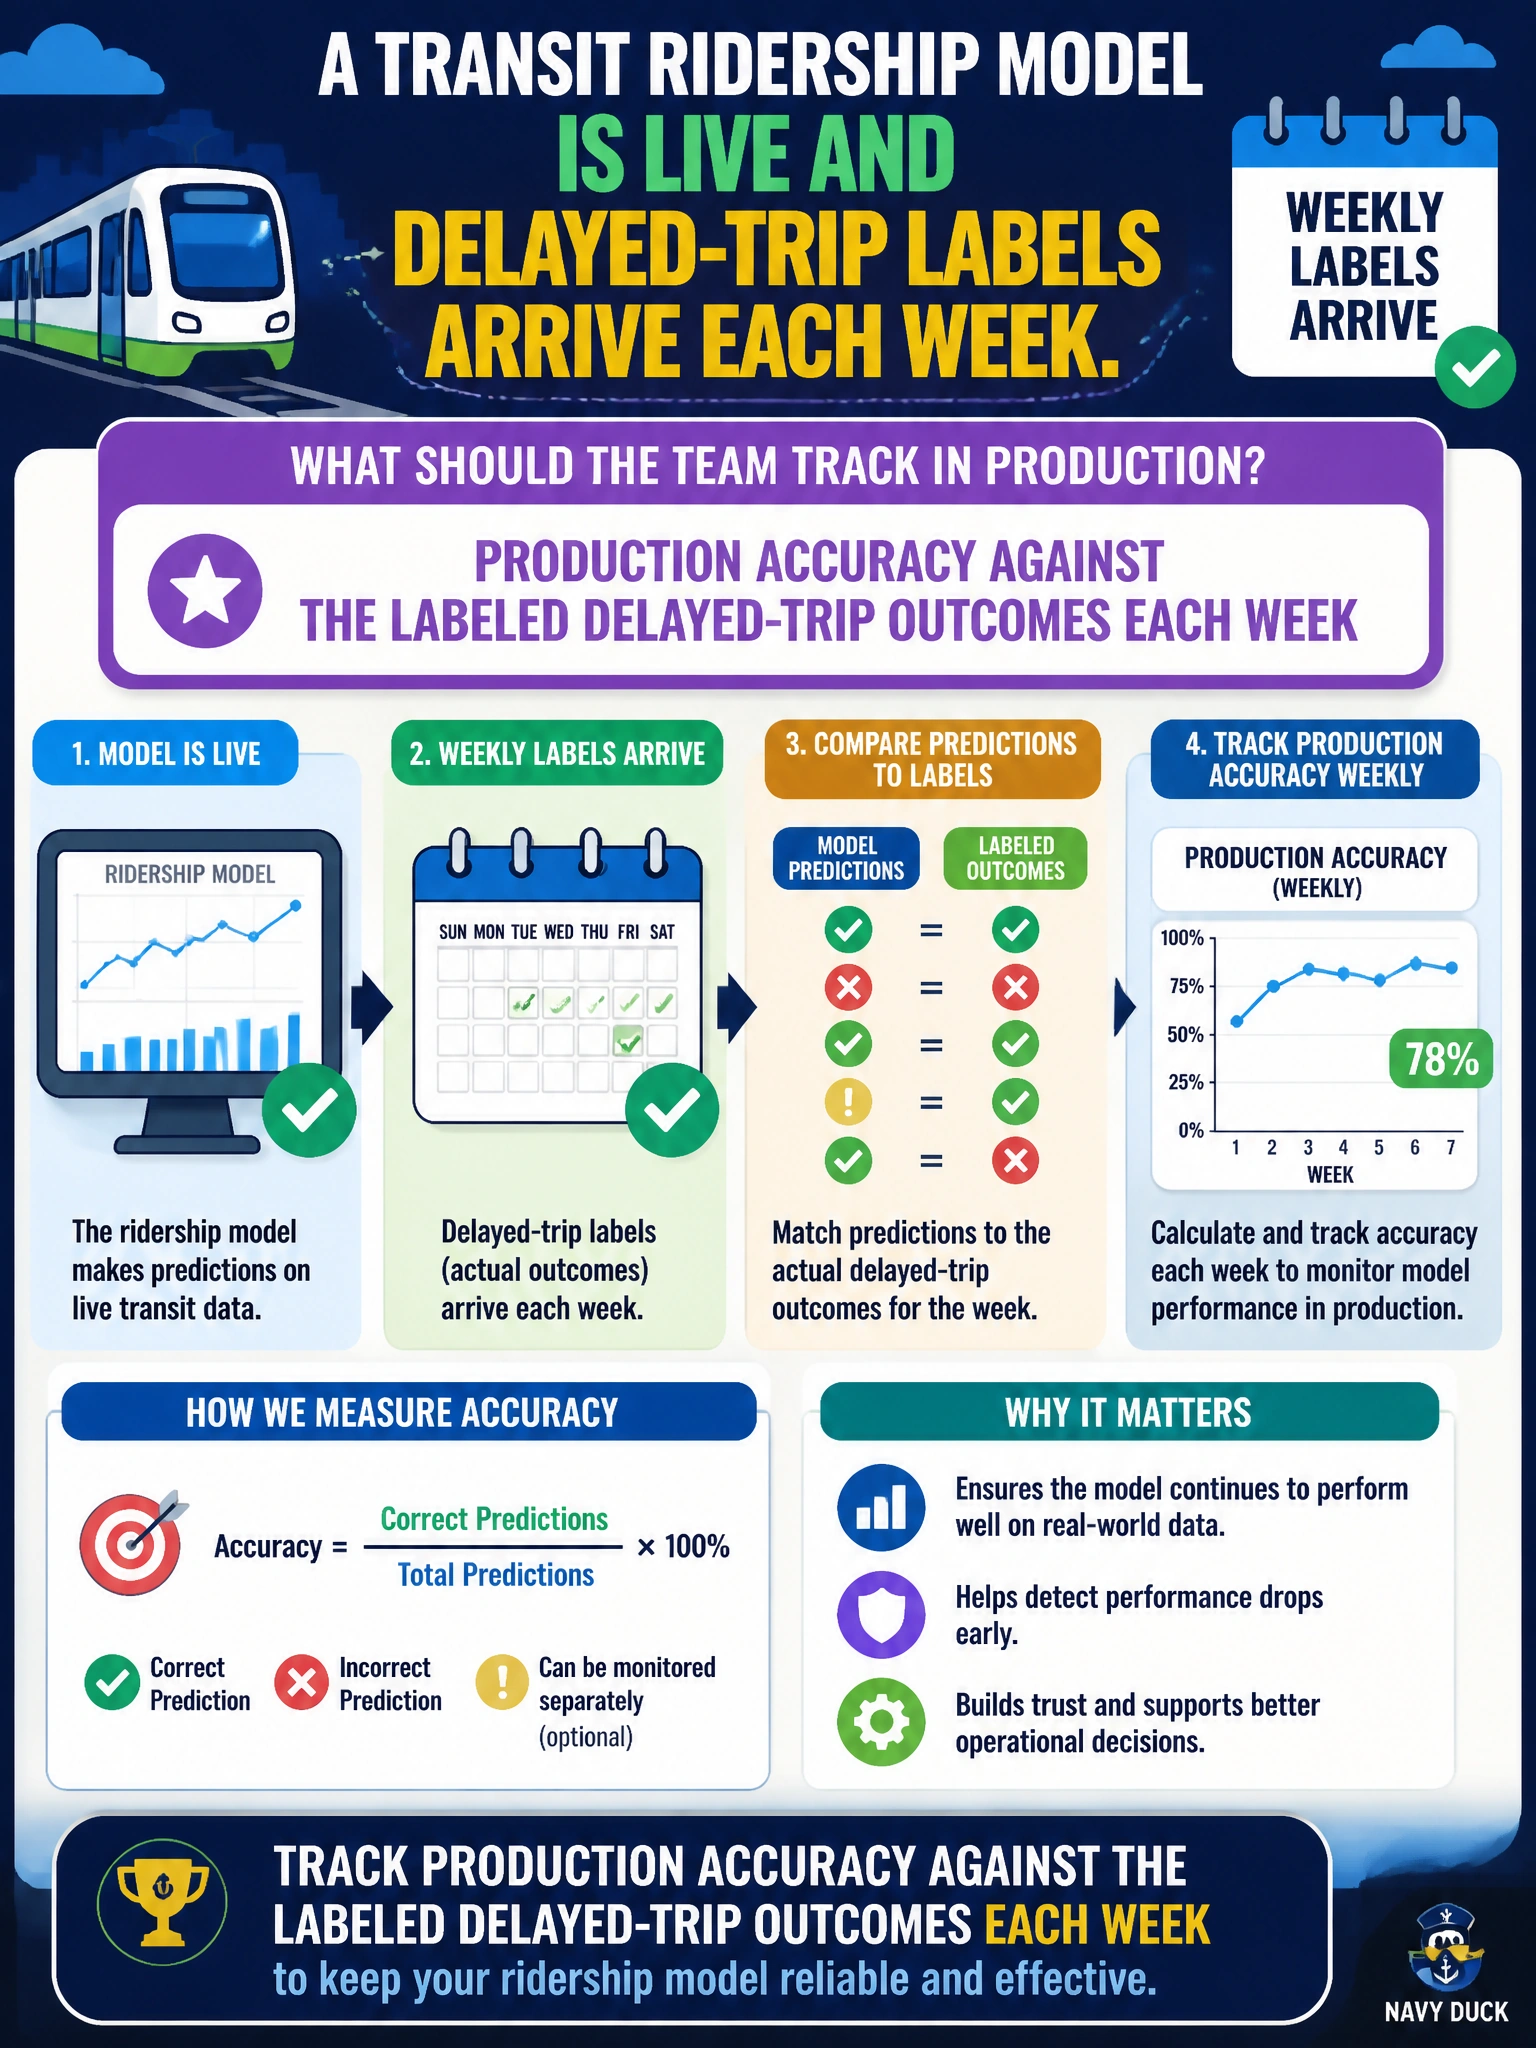
You cannot steer a ridership model on vibes. Each week, score how predictions line up with real delayed-trip labels and watch that production accuracy.
Full Explanation
Tracking production accuracy against the labeled delayed-trip outcomes each week is correct because a live transit ridership model must be judged on how its predictions compare to eventual ground truth when delayed-trip labels arrive. Weekly (or similarly scheduled) production performance metrics close the loop between scores served to operations and observed outcomes, revealing calibration and accuracy regressions that training-loss charts alone cannot show. That outcome-based monitoring is core to municipal MLOps for models with delayed labels.
Tracking production accuracy against the prior-week predicted outcomes each week fails because comparing live predictions to prior predictions measures agreement, not correctness, and cannot reveal how live predictions compare to the delayed-trip outcomes once they arrive. Tracking production recall of delayed-trip events on live unlabeled inputs each week fails because recall requires ground-truth labels to identify true delayed-trip events, so it cannot be computed on live unlabeled inputs and does not measure live ridership prediction quality once delayed-trip labels arrive. Tracking production training loss of the live ridership model on new inputs each week fails because training loss is a development optimization signal that requires labels, not a measure of whether live delayed-trip predictions match reality.
Exam caveat: when stems emphasize delayed labels arriving on a schedule, choose production metrics versus eventual outcomes—not production accuracy against prior-week predicted outcomes, production recall on live unlabeled inputs, or production training loss on new inputs.
Operational check: join weekly delayed-trip labels to the predictions served that week, compute accuracy (and related metrics) in the monitoring pipeline, chart trends, and alert owners when production accuracy breaches the transit team's negotiated floor.
Prefer to study offline? Printable PDF study book + test engine ($7.50, unofficial). These questions stay free here.