
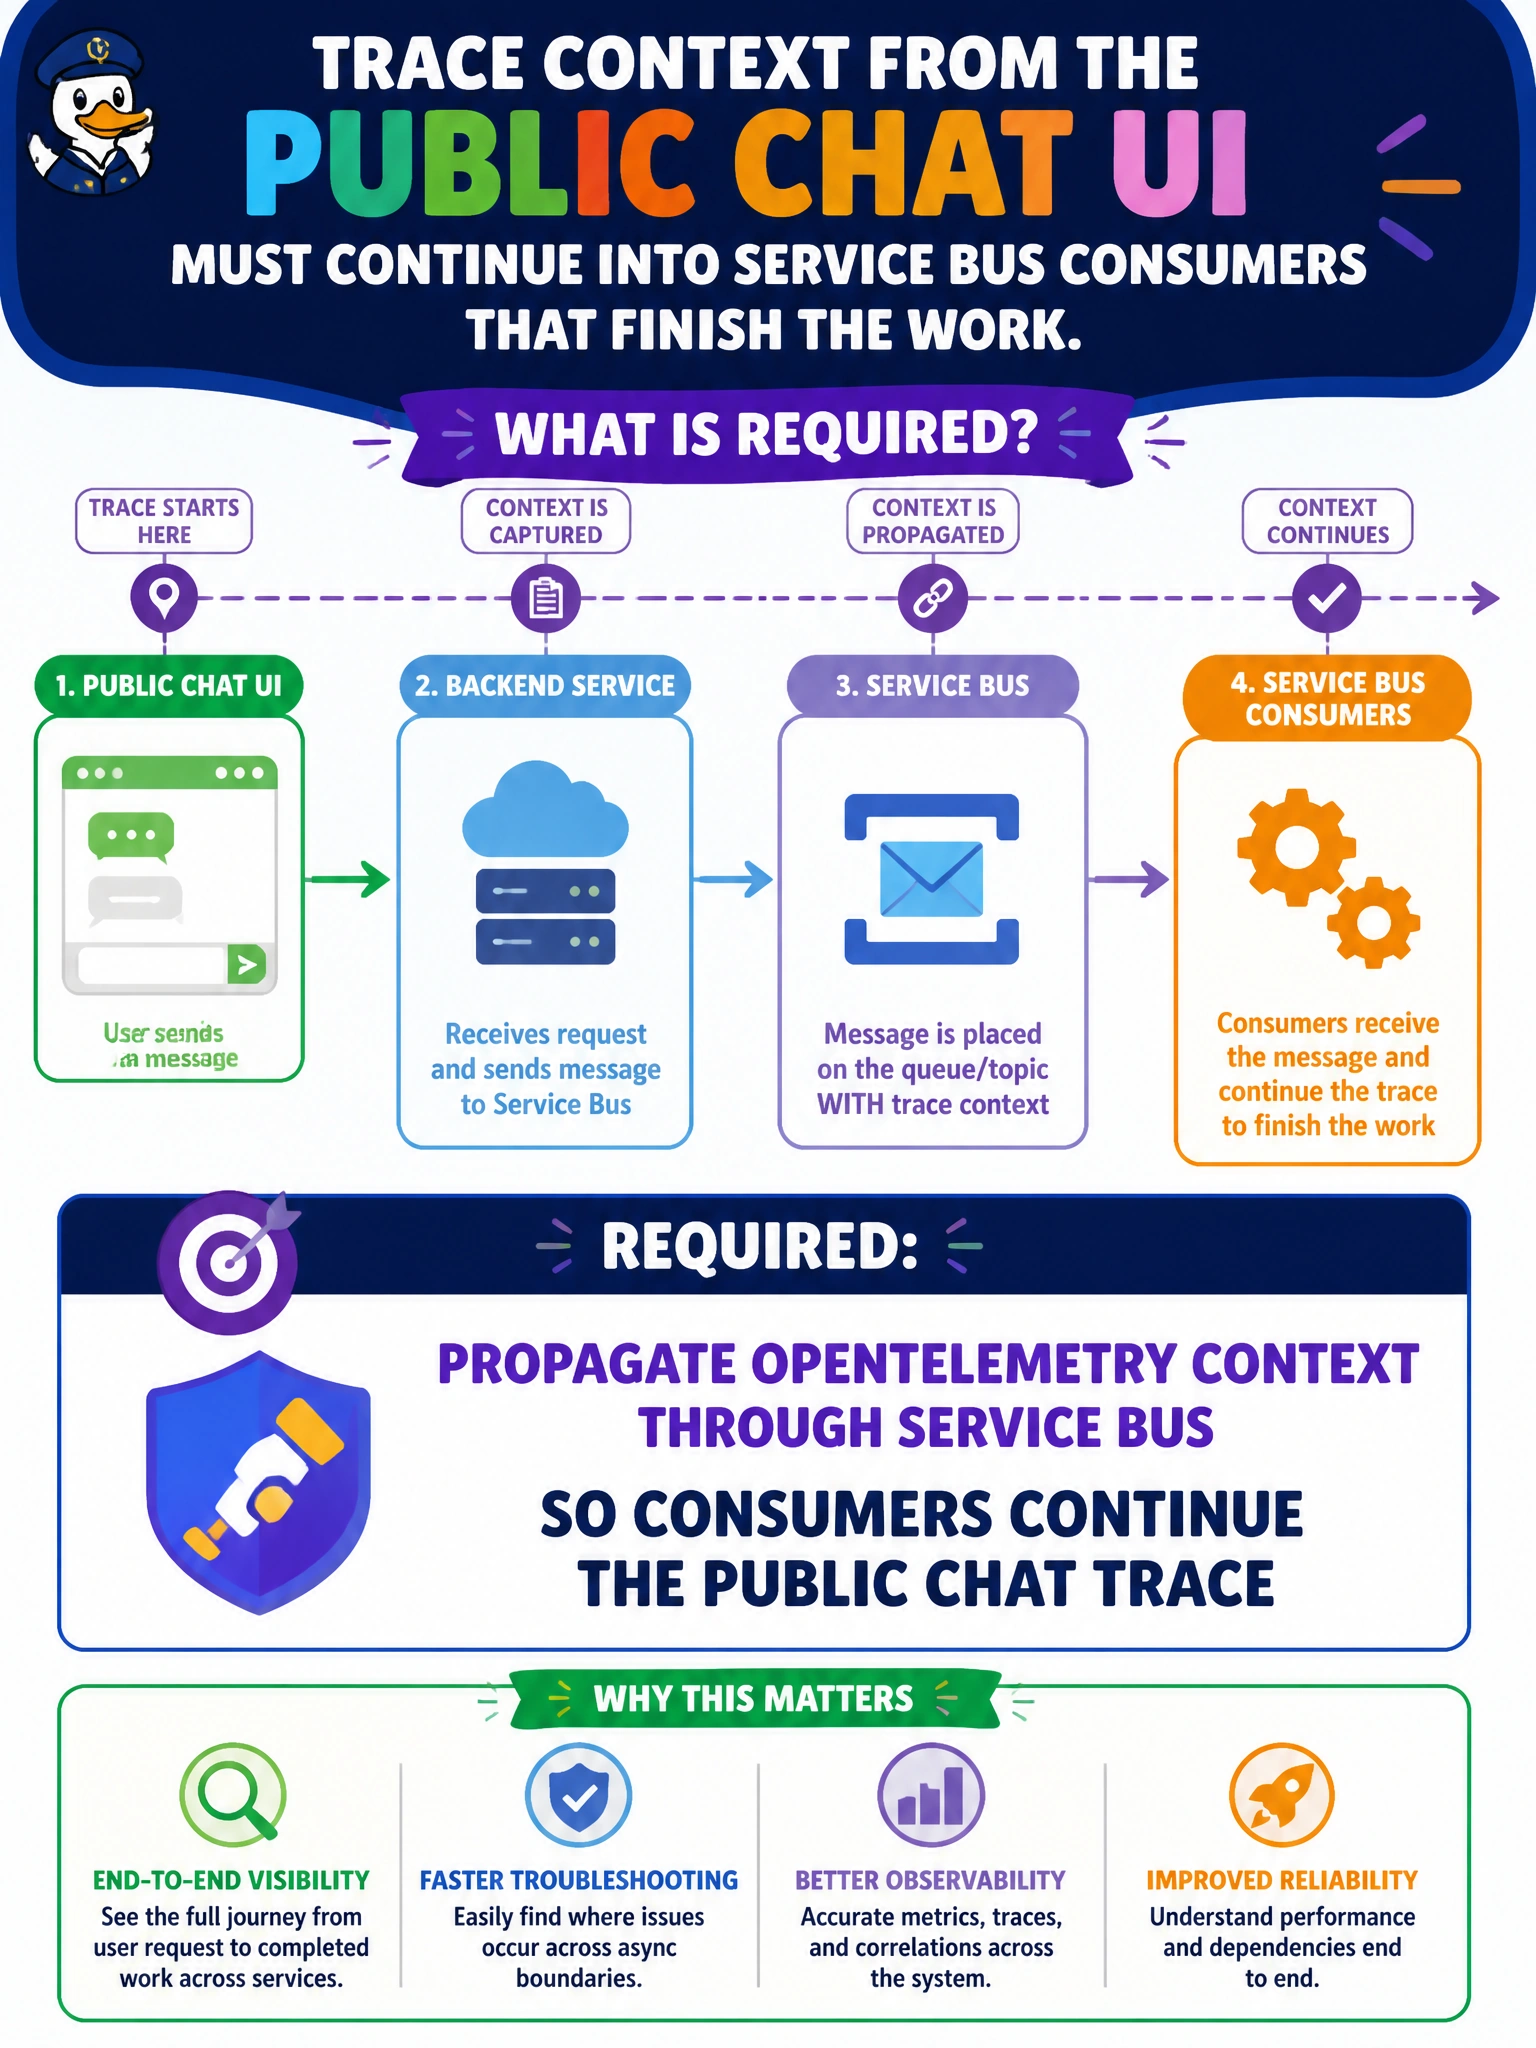
Trace context from the public chat UI must continue into Service Bus consumers that finish the work. What is required?
Select an answer to reveal the explanation.
Short Explanation
Context propagation is handing the relay baton—Service Bus consumers keep running the same race the chat UI started.
Full Explanation
When work starts in a public chat UI and finishes in Service Bus consumers, OpenTelemetry context must propagate through Service Bus so consumers continue the same trace. Producers inject trace context into message application properties (or the instrumentation library does so), and consumers extract that context to create child spans linked to the original chat request. Municipal ops can then follow a resident utterance from the web tier through queue latency into worker embedding, retrieval, or notification steps without losing the thread at the async boundary.
Dropping all trace headers when messages enter Service Bus so consumers start fresh ids fails continuity—each consumer invents a new root, and the chat request cannot be joined to downstream work except by fragile timestamps. Creating unrelated root spans in every consumer with no link to the chat request fails for the same conceptual reason: without links or continued context, distributed tracing stops at the queue. Replacing tracing with nightly CSV exports that lack per-request correlation fails real-time troubleshooting and cannot reconstruct a single resident conversation across hops.
Exam caveat: async messaging is a classic context-propagation gap on exams—HTTP middleware may be correct while queue publish/subscribe strips headers. Prefer standard OpenTelemetry messaging semantic conventions and ensure both send and receive are instrumented. Also decide whether to create consumer spans as children or links when processing fan-out, but do not drop context entirely.
Operational check: publish a chat-triggered message, inspect Service Bus application properties for traceparent (or equivalent), process it in a consumer, and confirm Application Insights shows one trace spanning UI → enqueue → consumer rather than disconnected roots.