
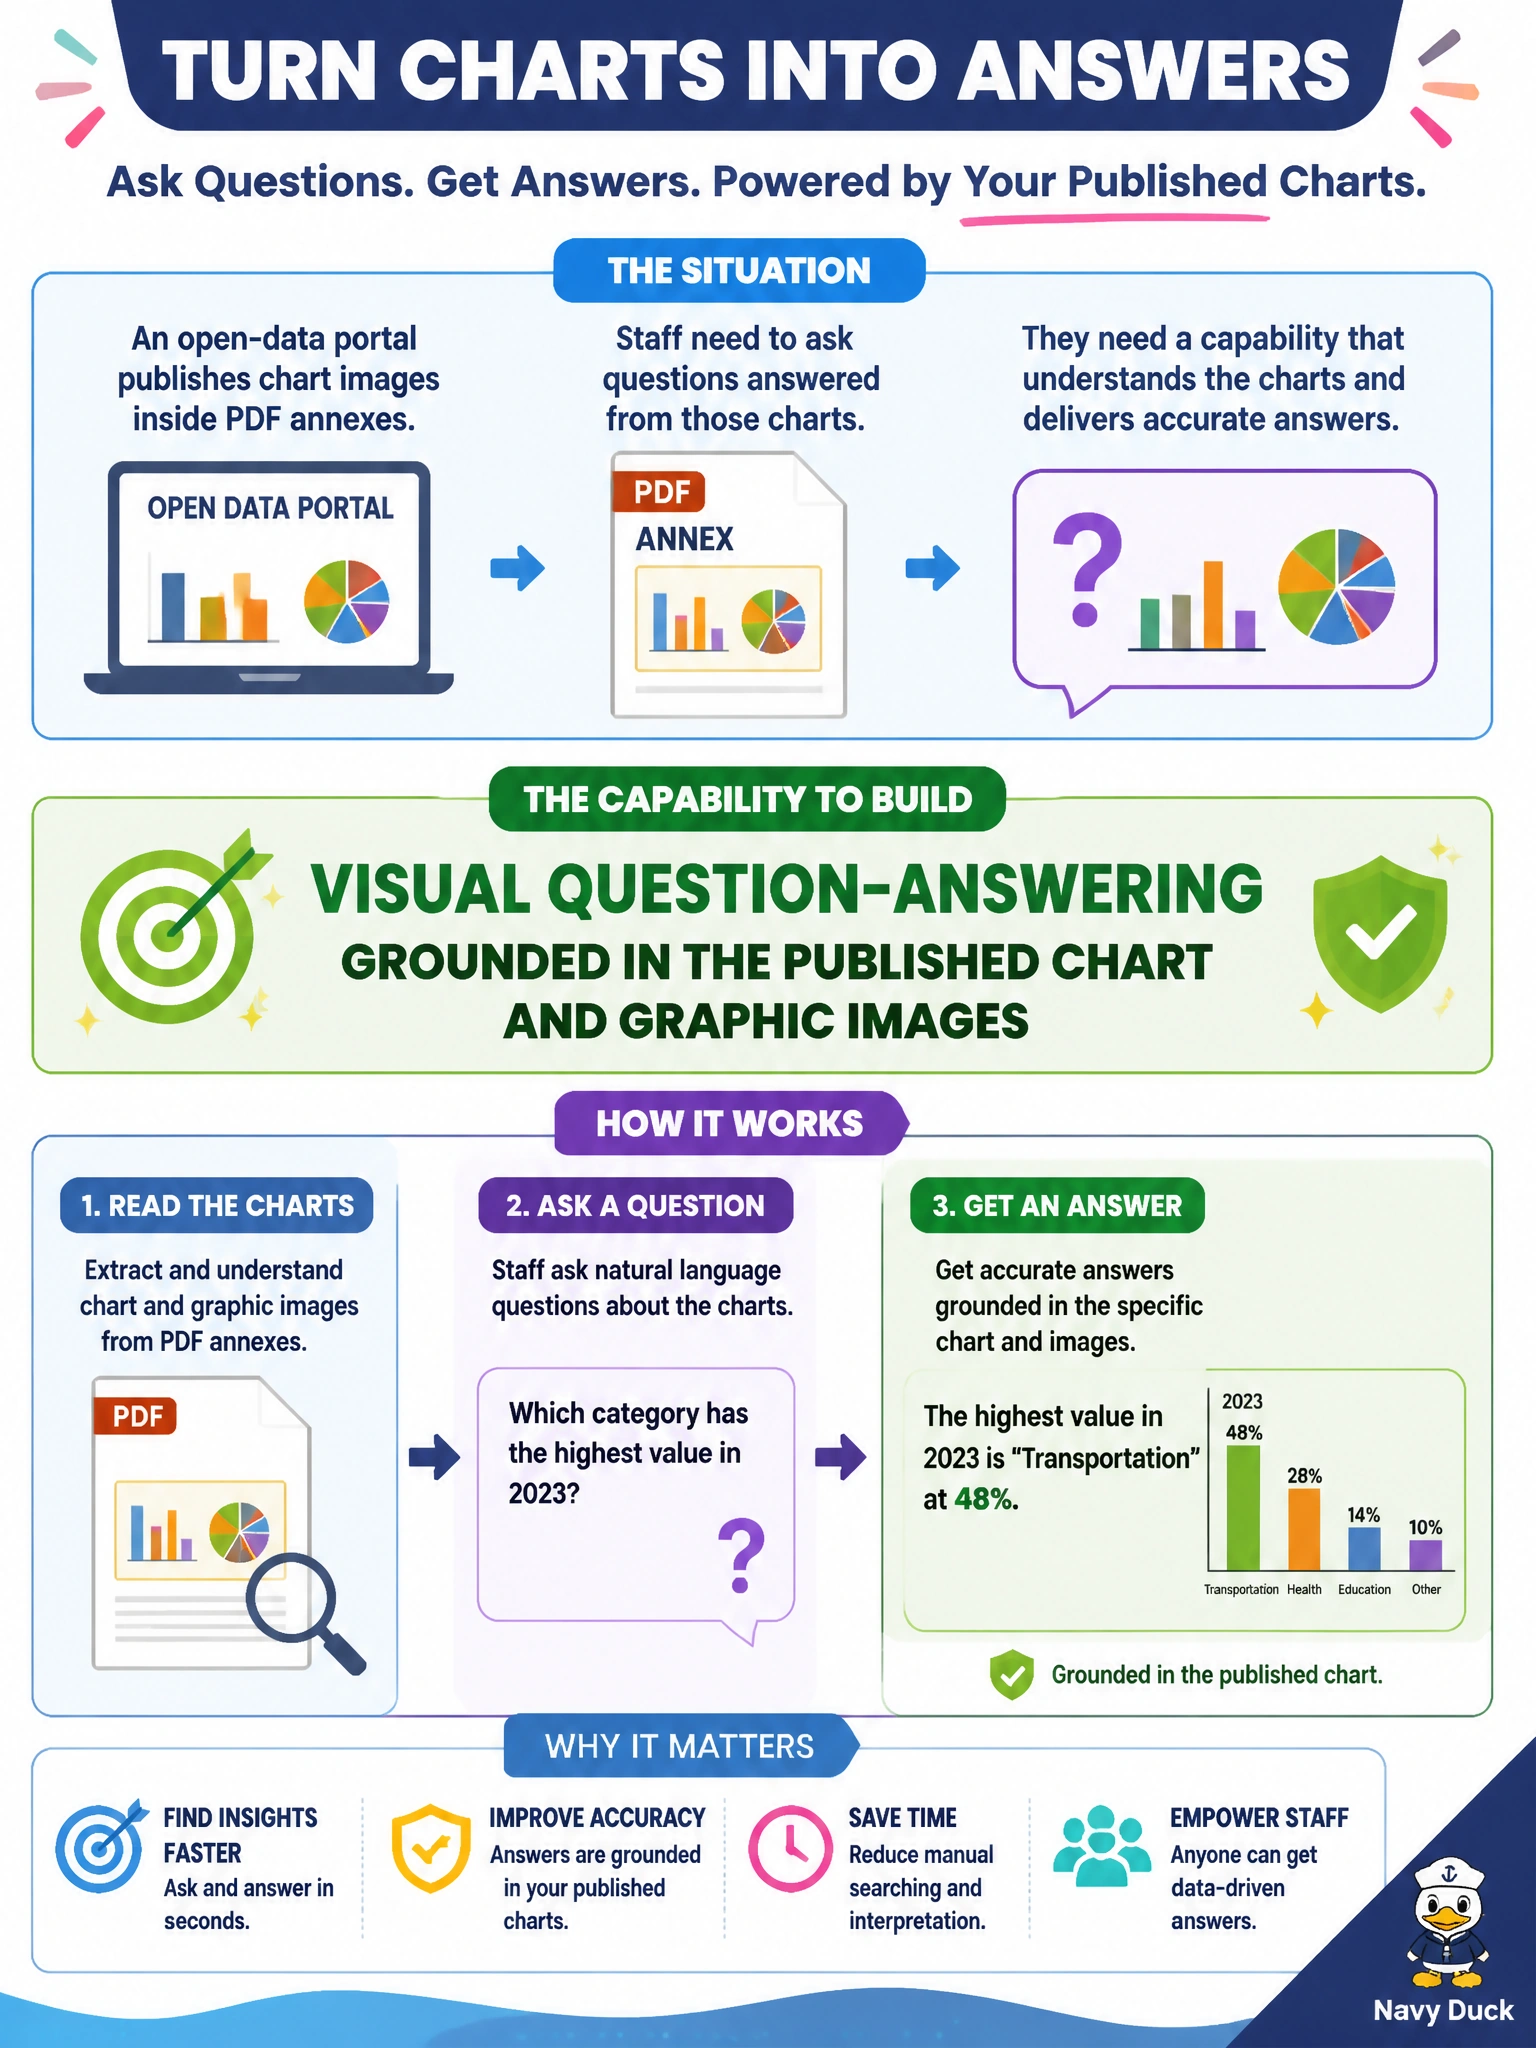
An open-data portal publishes chart images inside PDF annexes and wants staff to ask questions answered from those charts. Which capability should they build?
Select an answer to reveal the explanation.
Short Explanation
Charts hide answers in pixels and labels—you'll need visual Q&A so you can ask the picture itself, not just get a grounded caption describing it. Build VQA over those annex graphics. Grounded captioning, grounded table extraction, or grounded summarization from those graphics won't answer your specific questions about values or trends in the chart because you'll still need interactive Q&A.
Full Explanation
Visual question-answering over chart and graphic images lets staff ask questions whose answers are grounded in published visual data, not merely in surrounding text. An open-data portal that embeds chart images in PDF annexes should build VQA against those graphics so analysts can query values, trends, or categories visible in the chart. Automatic image captioning grounded in the published chart and graphic images cannot answer specific questions about axis labels or bar heights inside chart images because it produces only a descriptive caption of the graphic, not answers to staff questions; VQA can when the image content is available to the model. Automatic image captioning grounded in the published chart and graphic images fails whenever the answer requires a specific value, trend, or comparison in response to a staff question rather than a grounded description of the figure. Document table extraction grounded in the published chart and graphic images fails because chart images encode answers in visual marks such as bar heights, line slopes, and colors, not in structured row-column table cells that table extraction expects. Extractive summarization grounded in the published chart and graphic images copies only existing text from the graphic for overviews and never analyzes the plotted values, axes, or trends in the chart images to answer staff questions.
Exam caveat: chart VQA can misread scales, legends, or low-resolution embeds; numerical answers used for public decisions should be cross-checked against the underlying dataset when available. Operational check: enable VQA on sample annex charts, ask known questions with verified answers, compare model responses to the source data table, and present VQA as an assistive layer beside downloadable data files.
Prefer to study offline? Printable PDF study book + test engine ($7.50, unofficial). These questions stay free here.