
An open-data portal's RAG answers feel slow. What observability step helps the team find whether retrieval or the model is the bottleneck?
Select an answer to reveal the explanation.
Short Explanation
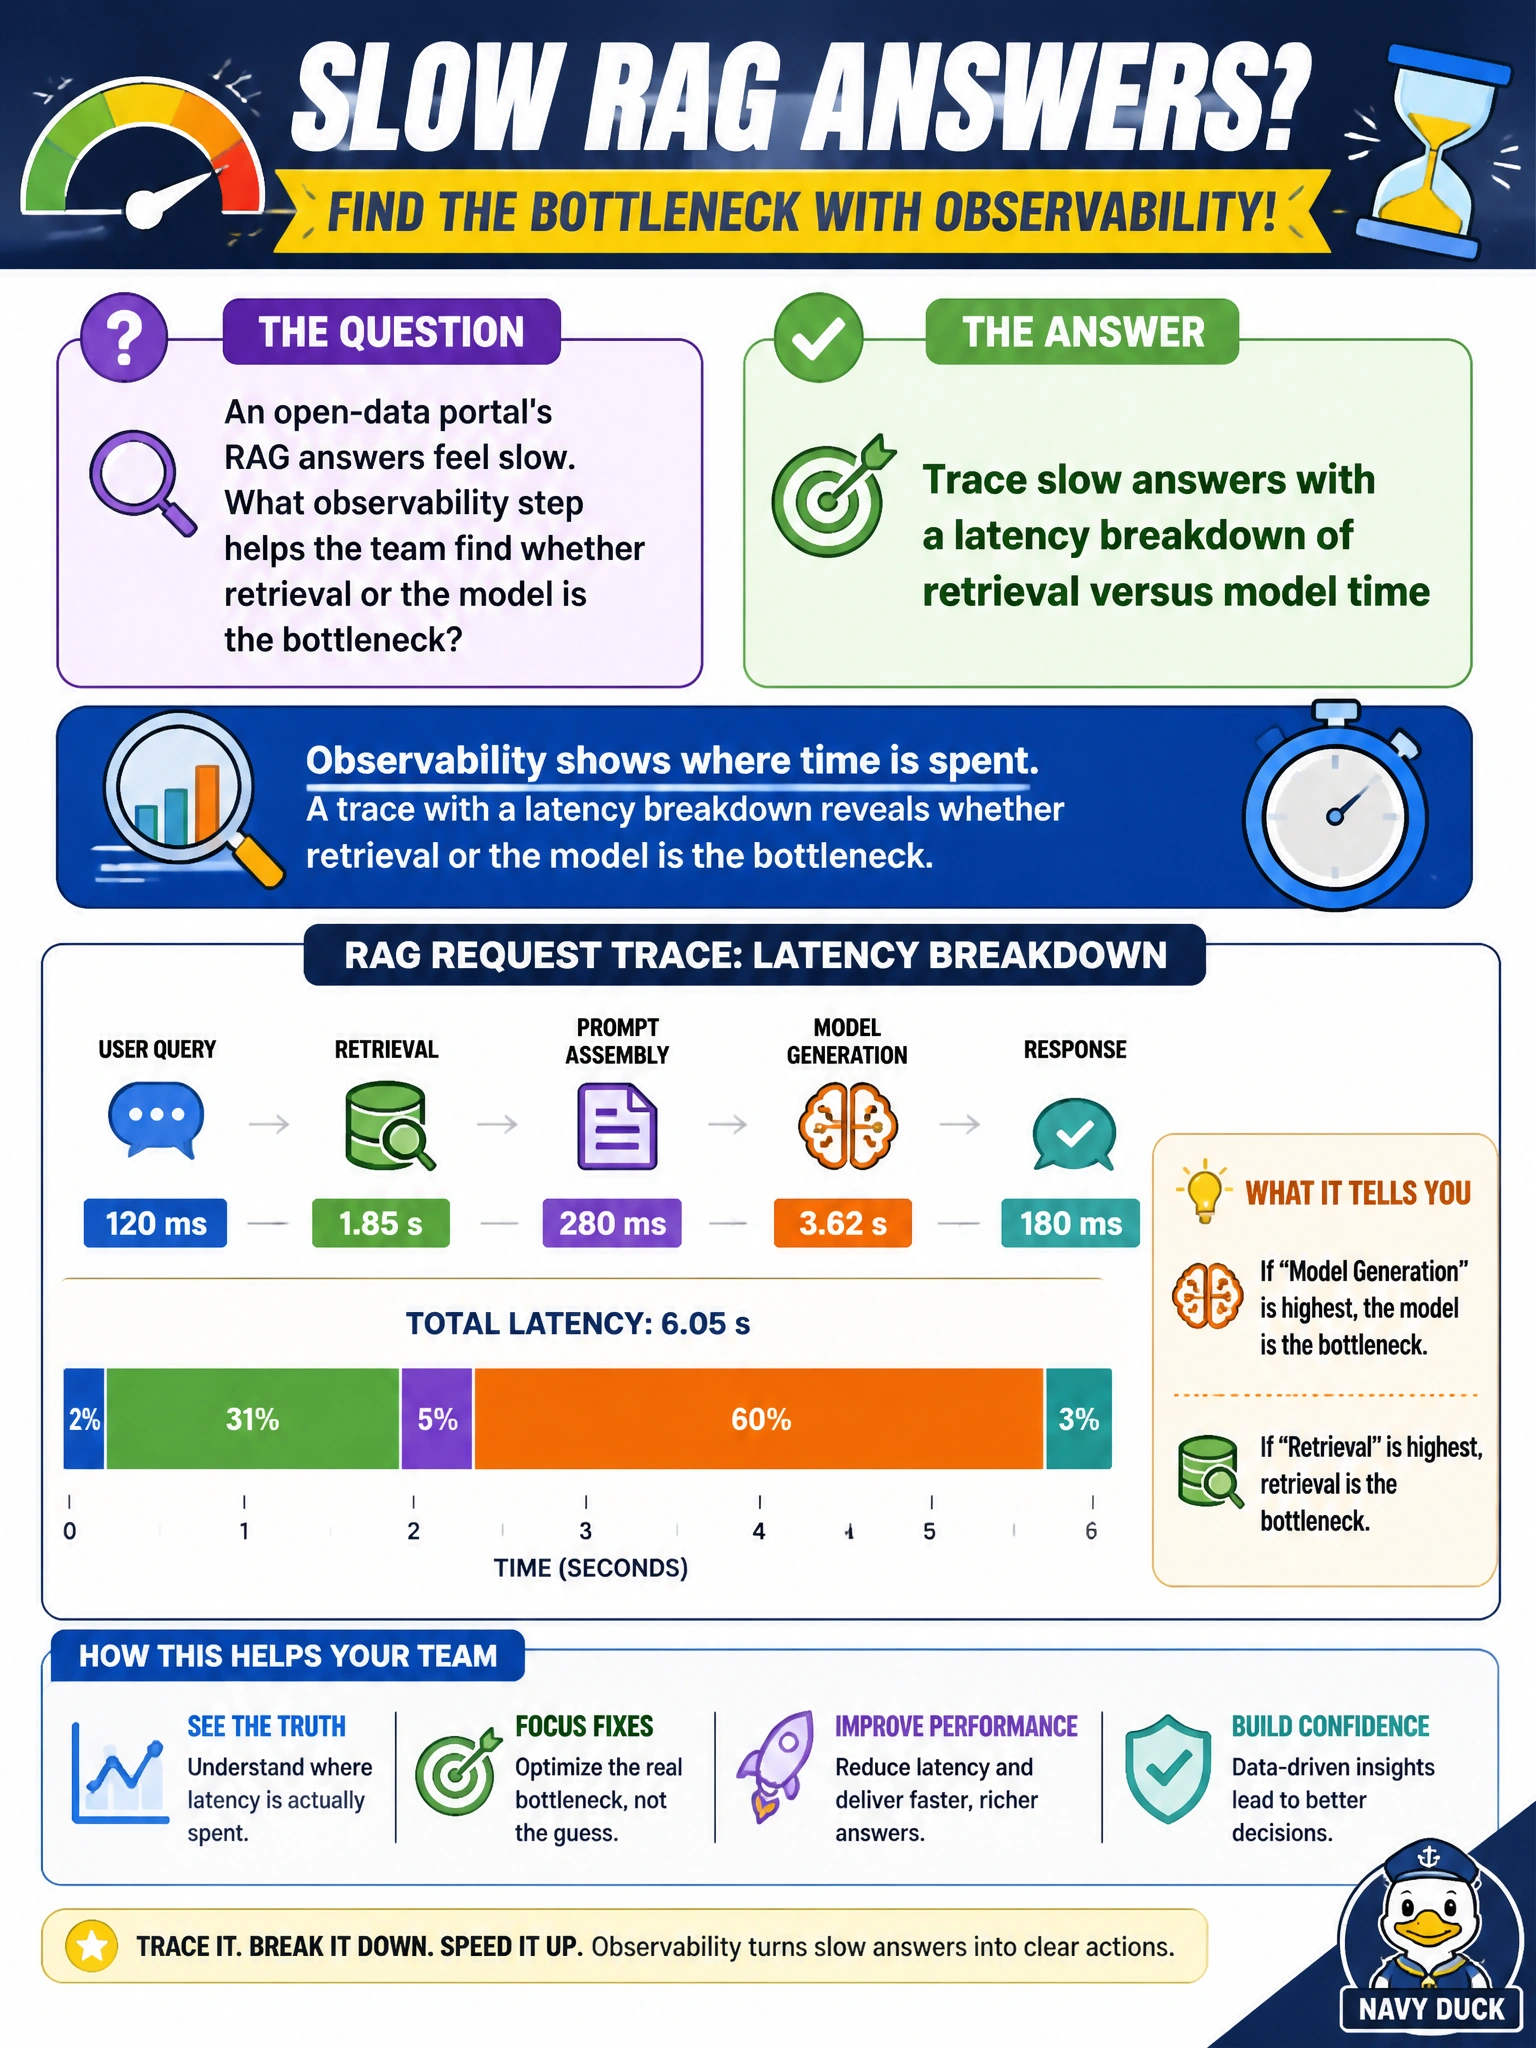
Slow is a clue, not a diagnosis — you need to see which station on the assembly line actually stalled. Break latency into retrieval versus model time so the open-data team knows what to fix. Total latency charts, index build times, and model-only decoding profiles are all useful, but they don't tell you where the time went.
Full Explanation
When an open-data portal’s RAG answers feel slow, tracing slow answers with a latency breakdown of retrieval versus model time is the observability step that finds the bottleneck. Aggregate slowness is not a diagnosis. Stage timing shows whether the index/retrieval path or the generative model dominates. That attribution tells the team whether to tune retrieval, caching, and chunking—or model choice and generation settings—on the civic open-data stack.
Charting slow total end-to-end answer latency aggregating retrieval and model time spans confirms answers are slow overall, but a single total hides the per-stage split and cannot say whether retrieval or the model is the bottleneck. Measuring vector index build duration during offline ingestion tracks how long offline indexing takes, which helps ingestion health, but build time is separate from live query time and cannot attribute a slow answer to retrieval versus generation. Profiling slow model decoding latency for detailed token generation step timing breakdowns drills into the model stage alone, which helps once the model is known to be slow, but without retrieval timing alongside it you cannot tell whether retrieval or the model dominates.
Exam caveat: RAG latency diagnosis requires stage breakdown (retrieval vs model)—not total latency, offline build timing, or model-only decoding profiles alone, however useful those are for their own purposes. Operational check: instrument retrieval and model spans on slow open-data answers, dashboard p95 by stage, compare against baselines after releases, and prioritize fixes on the dominant stage before changing unrelated components.
Prefer to study offline? Printable PDF study book + test engine ($7.50, unofficial). These questions stay free here.