
A Copilot Studio agent at Bellows College has been in production for 60 days. The analytics show an average CSAT score of 2.8 out of 5. The team wants to identify which specific topics are driving low satisfaction scores. What should they do?
Select an answer to reveal the explanation.
Short Explanation and Infographic
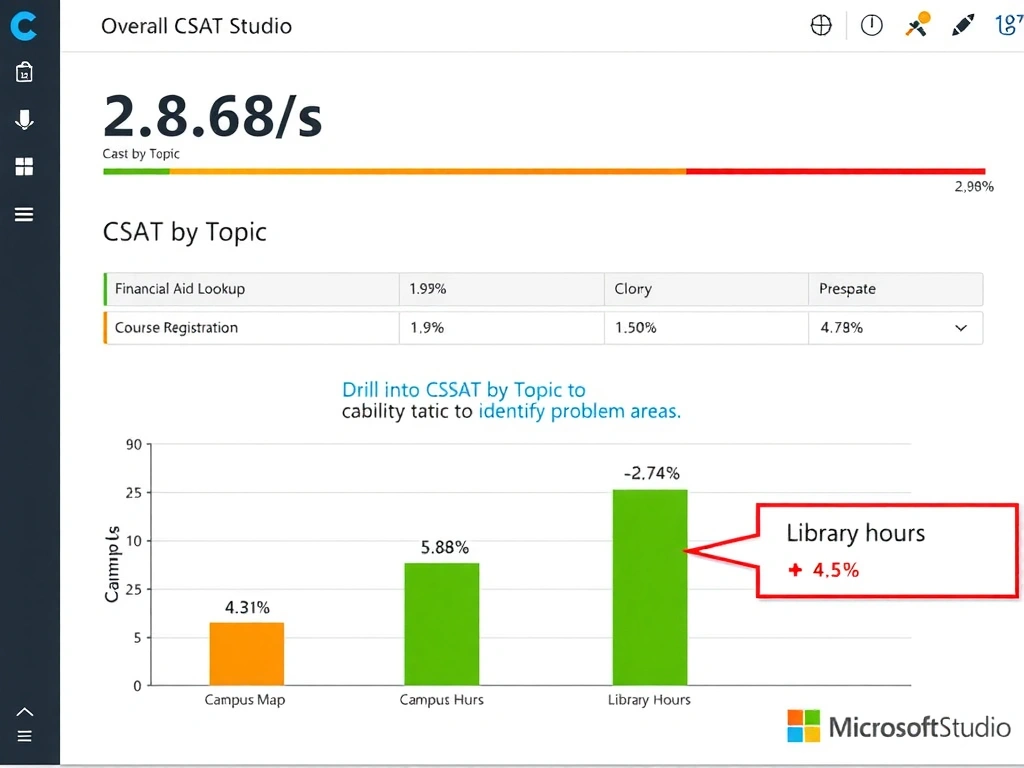
A 2.8/5 CSAT is a red flag, but the average alone doesn't tell you what's broken. Copilot Studio's Analytics lets you drill into CSAT by topic — find the low-scorers and fix those specifically. The correct answer is B.
Full explanation below image
Full Explanation
## Why B is Correct Copilot Studio's Analytics section includes CSAT (Customer Satisfaction) data that is broken down by topic when CSAT surveys are enabled. By drilling into the topic-level CSAT view, the team can identify which specific topics (e.g., 'Financial Aid Lookup' or 'Course Registration') are receiving low ratings and investigate the root cause — whether it's incorrect answers, poor tone, or incomplete information.
## Why the Distractors Are Wrong A (Knowledge freshness report): Knowledge freshness reports indicate whether connected knowledge sources have been recently indexed. While stale content can cause low CSAT, this report doesn't directly show which topics users are dissatisfied with.
C (Manual transcript tagging): Manual transcript review is labor-intensive and qualitative. The Analytics section provides automated, quantitative CSAT aggregation by topic — no manual work required for this analysis.
D (Increase temperature): Response temperature affects creativity/randomness in generation. It is not a standard Copilot Studio user-configurable setting and would not reliably address the root cause of specific low-CSAT topics.
## Exam Tip For satisfaction-driven improvements: always start with topic-level CSAT analysis in Analytics before making agent-wide changes. Shotgun changes without topic-level diagnosis often fix nothing and break something else.