
A plug-in intermittently fails in production with a generic business process error, and the team cannot attach a debugger there. The developer wants the plug-in to record its execution path and key values so the details can be reviewed after a failure. What should the developer implement?
Select an answer to reveal the explanation.
Short Explanation
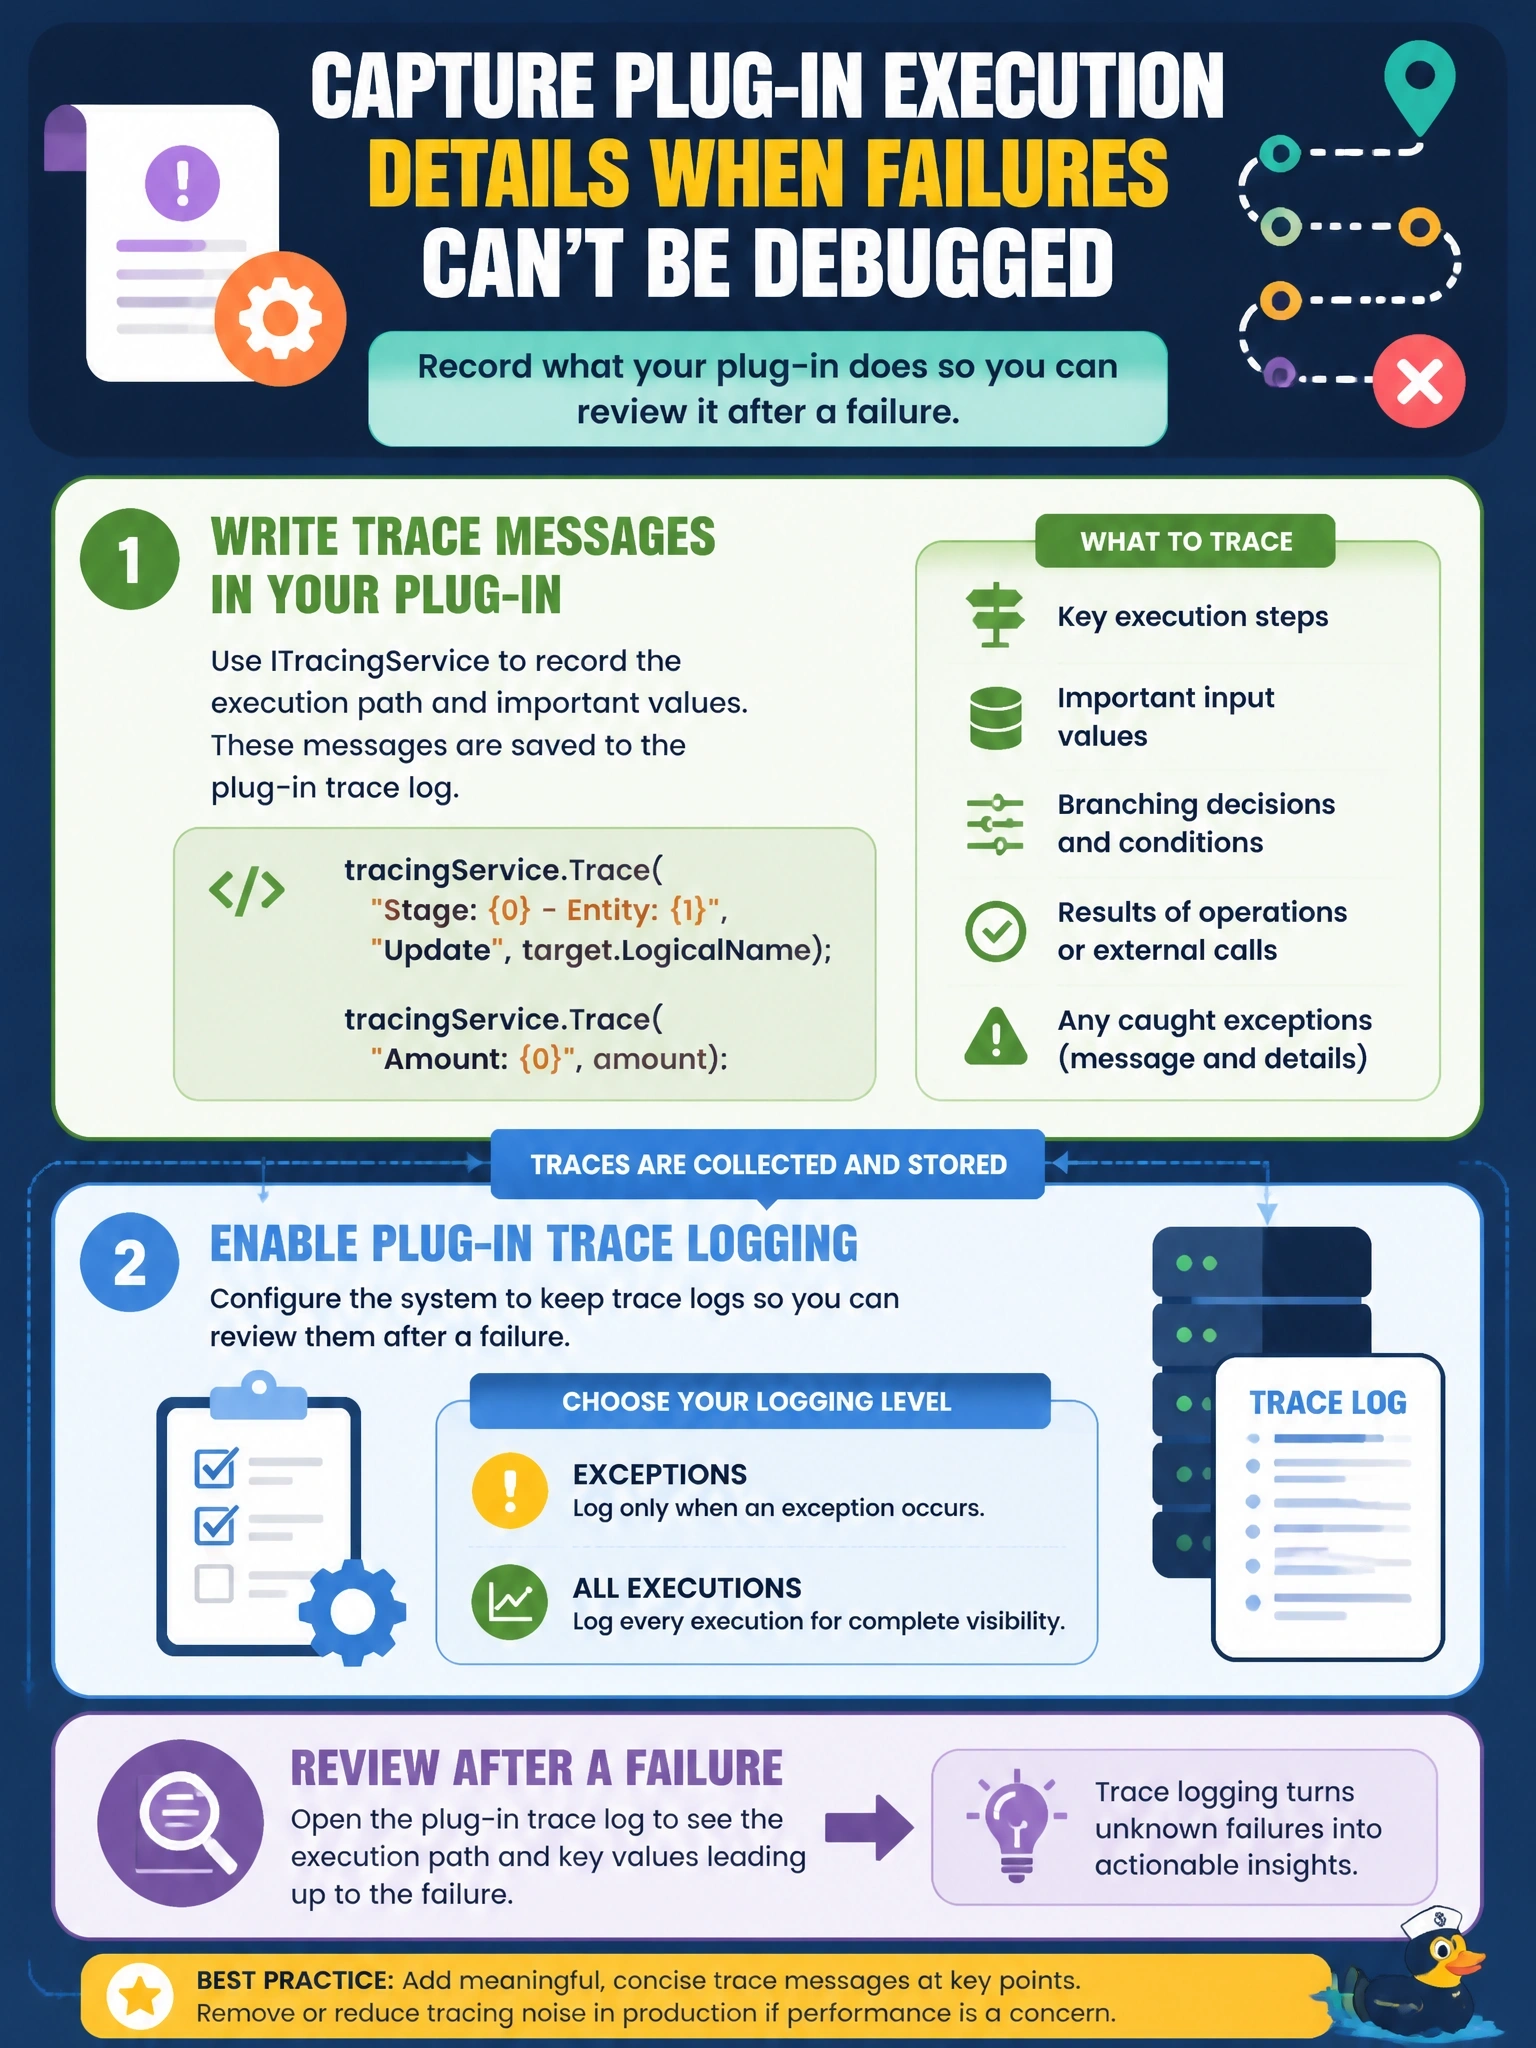
ITracingService is the plug-in's black box recorder: you write breadcrumbs as you go, and the plug-in trace log keeps them for later. Console output and local files go nowhere in the sandbox. Flip trace logging on, or your breadcrumbs vanish.
Full Explanation
Plug-ins obtain ITracingService from the service provider and call Trace to write diagnostic messages during execution. When the environment's plug-in trace log setting is set to log exceptions or all executions, Dataverse writes those messages, together with context such as the message, stage and duration, to the plug-in trace log table, where developers can review them after a failure without a debugger. Logging on exception keeps volume low in production, while logging all executions helps during testing. Console.WriteLine output is not captured by the sandbox and there is no diagnostic console to read it from, so the messages are lost. Plug-ins run in a sandbox with restricted file system access, so writing a local log file is blocked and there is no supported way to download files from the worker. Storing text in a static field is unsafe because plug-in instances are cached and reused across concurrent executions, so text from different requests can mix and leak, and appending it to the exception message exposes internals to end users. Exam caveat: trace output from a synchronous plug-in that fails is still written to the trace log, and trace text is also returned with the error details. Operational check: enable trace logging, reproduce the failure, and query the plug-in trace log for the type name to confirm the messages appear.