
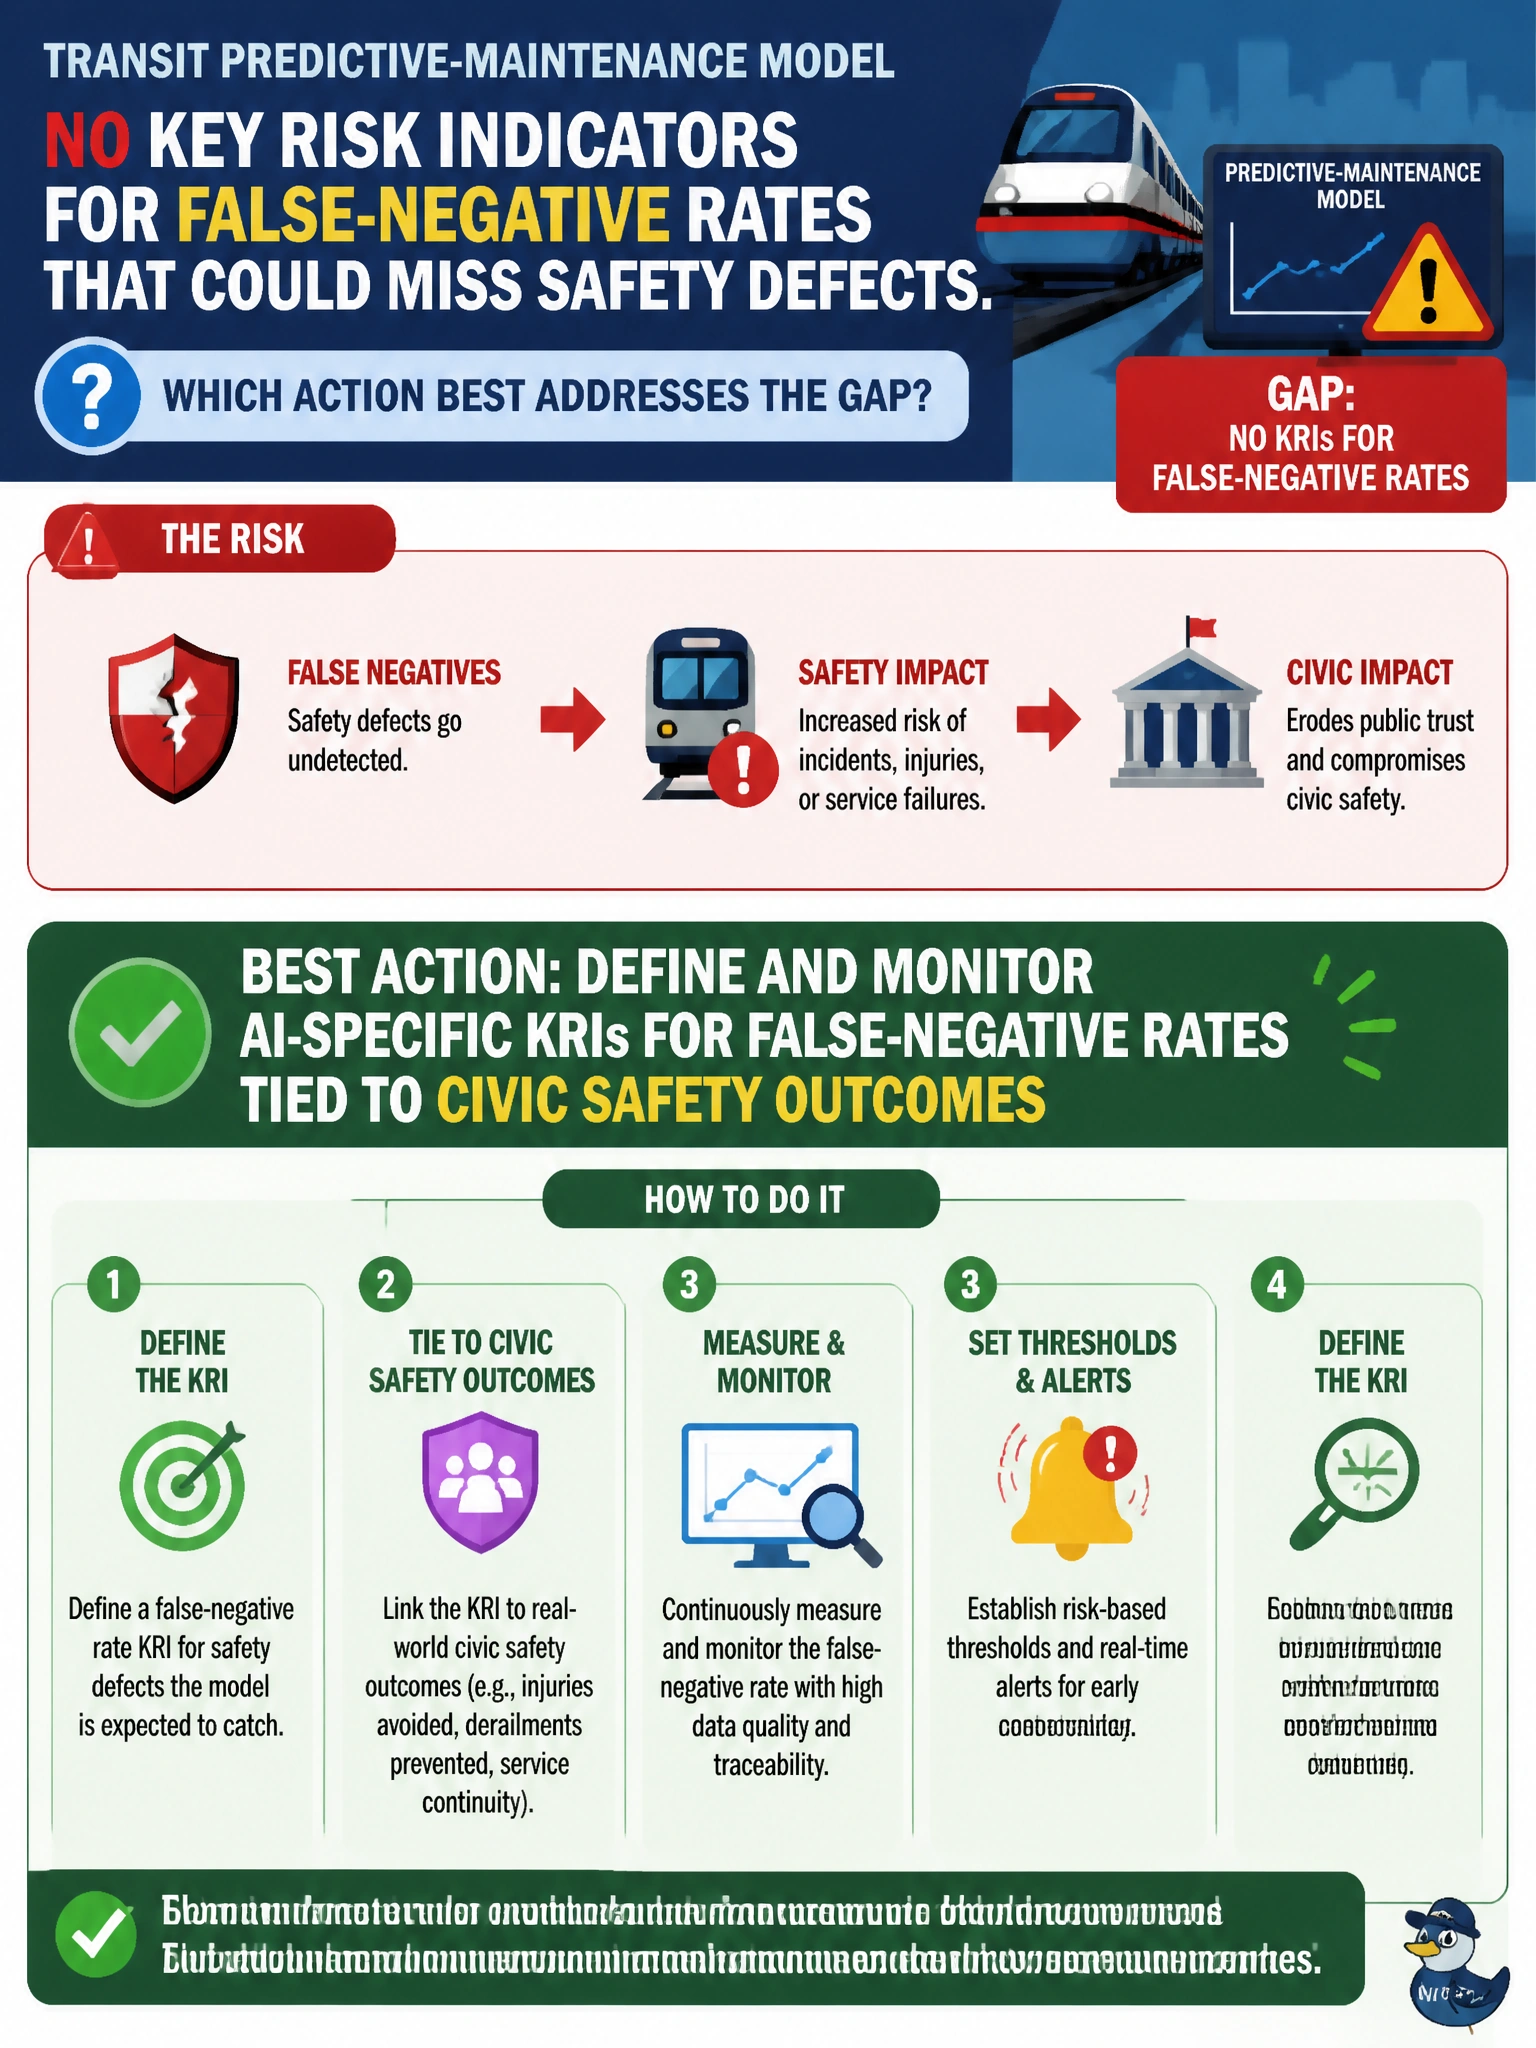
A transit predictive-maintenance model has no key risk indicators for false-negative rates that could miss safety defects. Which action best addresses the gap?
Select an answer to reveal the explanation.
Short Explanation
Missing a cracked axle is worse than crying wolf once — false negatives hurt. Give the model KRIs that watch how often real safety defects slip through. Relying on overall accuracy and uptime as safety proxies won’t catch the quiet misses, since those numbers can look fine while real defects go undetected.
Full Explanation
Defining and monitoring AI-specific KRIs for false-negative rates tied to civic safety outcomes best closes the gap. Transit predictive-maintenance models that miss real defects create safety exposure; overall accuracy can look healthy while rare but critical misses accumulate. KRIs that track false-negative rates—and link them to inspection escapes, defect severity, and rider-safety outcomes—give leadership an early signal that the model’s civic risk posture is degrading.
Monitoring overall model accuracy and system uptime as proxies for safety performance fails because these aggregate metrics do not measure safety-defect detection performance and divert monitoring away from the AI’s actual risk mode: a system can be accurate and available while still missing rare, critical defects. Tracking false-positive alert rates to optimize maintenance scheduling and inspection costs fails because it targets cost and workload rather than the safety gap; reducing false positives does not detect the real defects the model misses and may even discourage the sensitive alerting needed to catch false negatives. Reviewing defect precision trends in quarterly business reviews tied to operational efficiency goals fails because precision measures how many alerts are correct, not how many real defects were missed; quarterly efficiency reviews are too infrequent and business-focused to close the safety KRI gap or provide auditors with the needed evidence.
Exam caveat: a KRI without thresholds, owners, and escalation to maintenance action is a vanity chart; indicators must trigger investigation and work orders, not only sit on a slide. Operational check: confirm dashboards report false-negative or missed-defect rates against agreed thresholds, sample recent threshold breaches for documented response, and verify safety stakeholders receive those KRIs—not only data-science teams.