
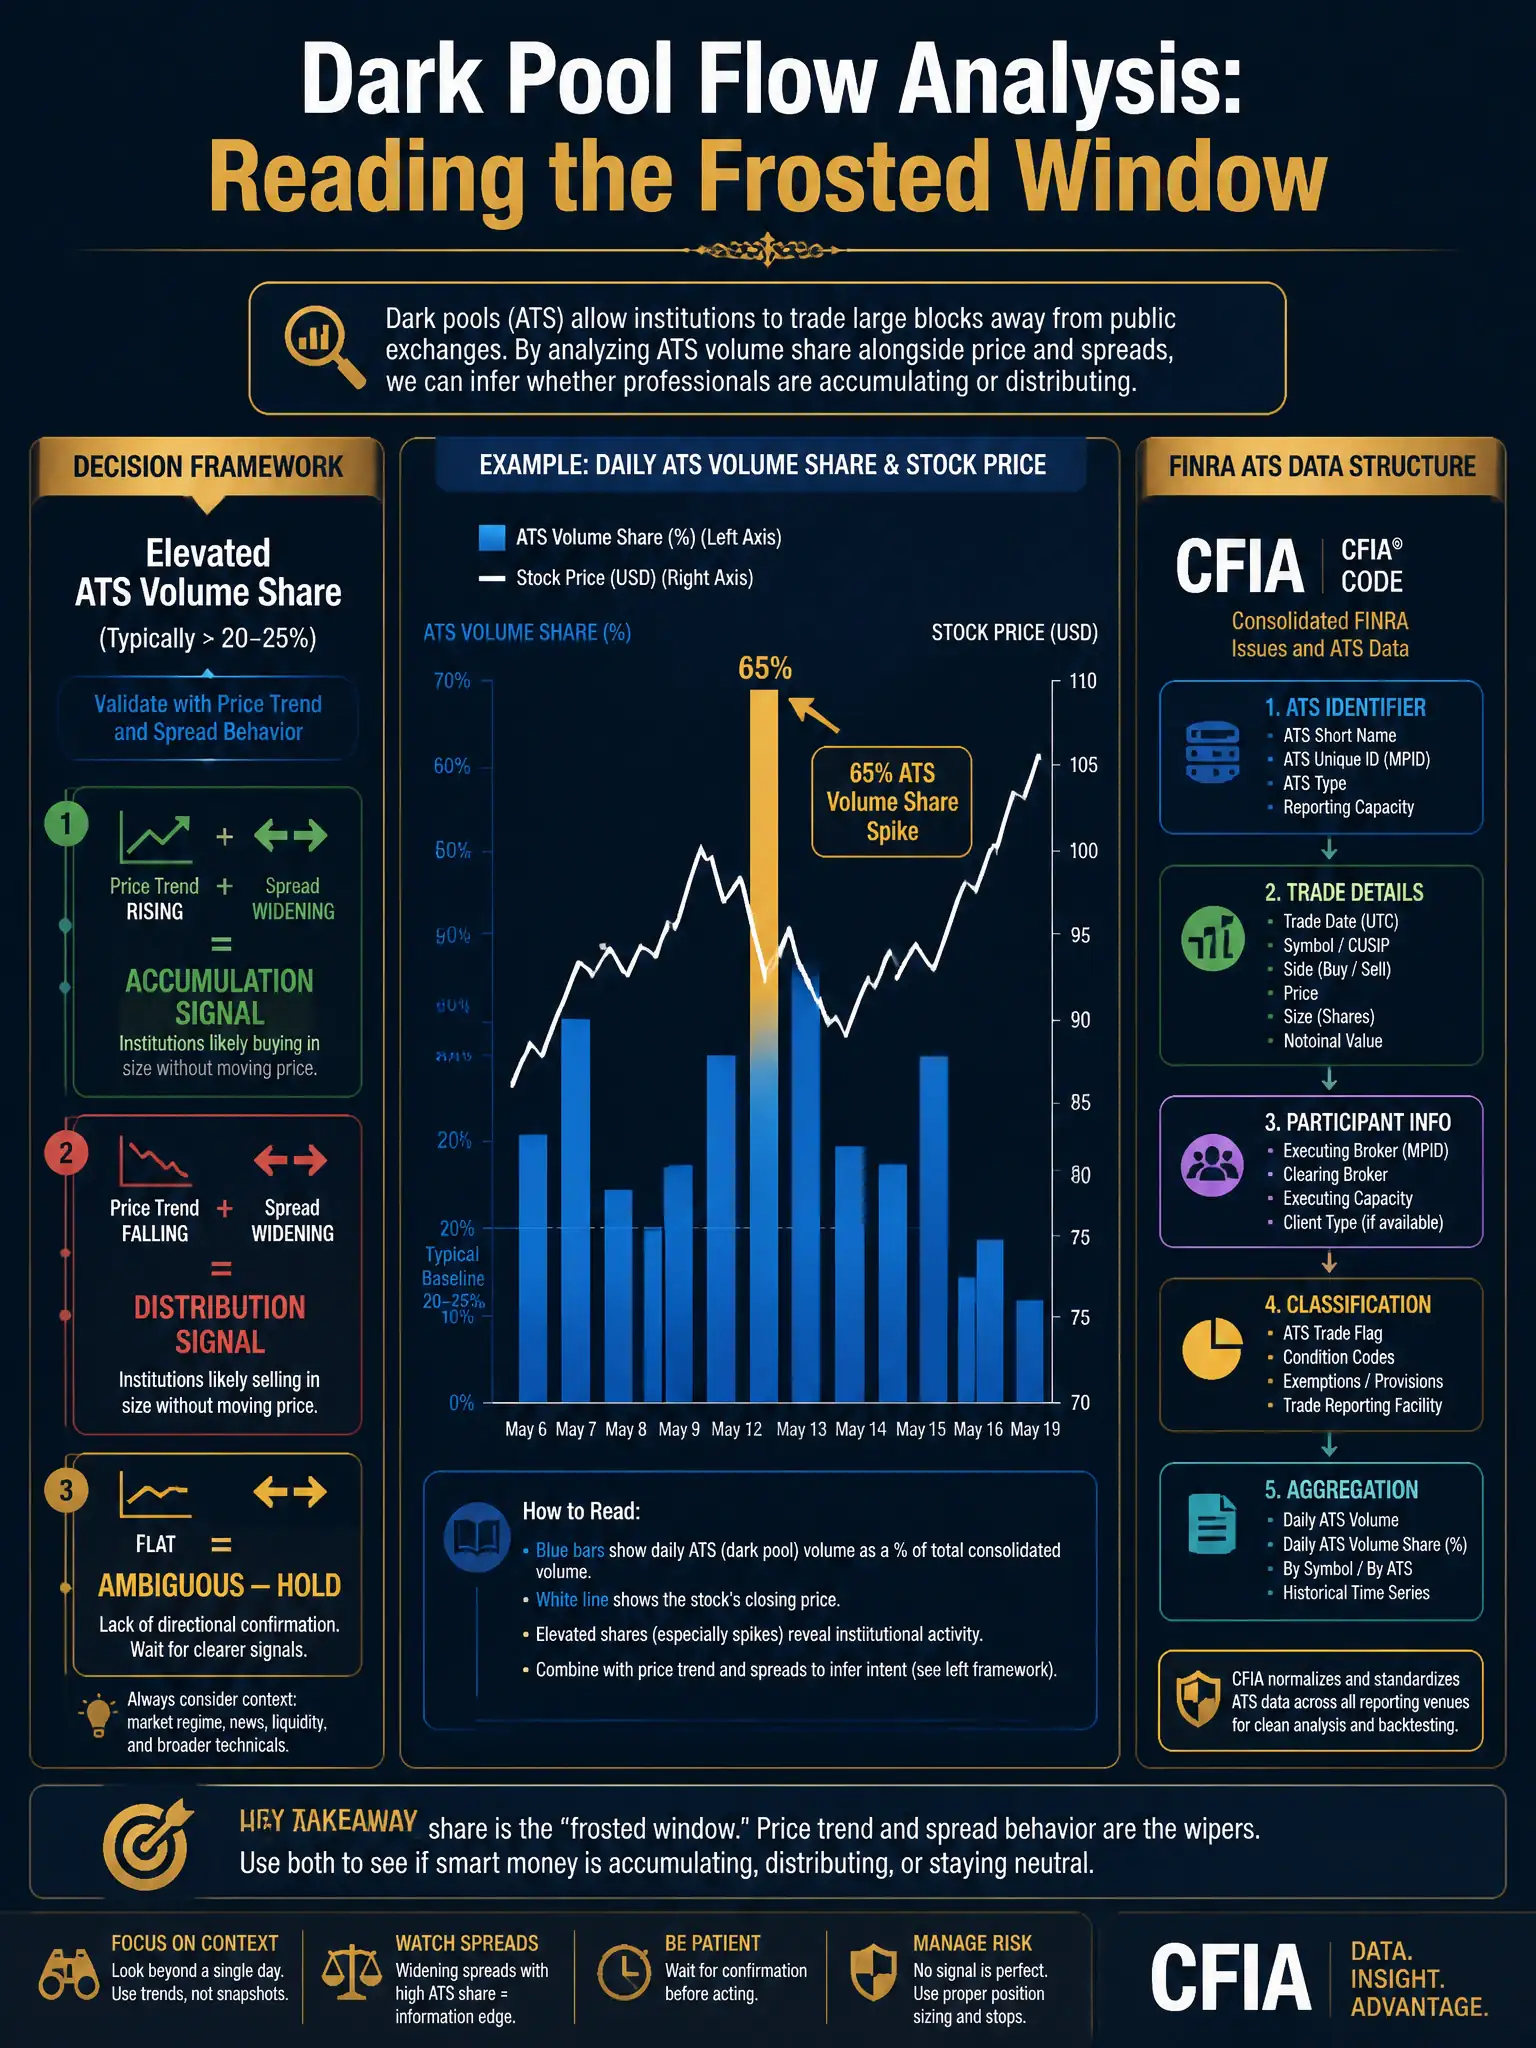
A systematic fund's alternative data team gains access to FINRA ATS (dark pool) trade reporting data. They observe that dark pool volume in a mid-cap stock has spiked to 65% of total consolidated volume over a five-day window, significantly above the historical average of 30%. Which inference about this pattern is MOST analytically sound?
Select an answer to reveal the explanation.
Short Explanation
Think of dark pools like a private back room where big players do big deals quietly. You can see the back room is busy, but through a frosted window; you know something's happening, but you can't tell if the big player's buying or selling. That ambiguity is why you need to triangulate dark pool data with price action before acting.
Full Explanation
The correct inference is that the spike in dark pool share may reflect large institutional block execution seeking price impact minimization; however, without directional flow data (buyside vs. sellside initiator), the signal is ambiguous and requires cross-validation with price trend and spread data. Dark pool volume data reported under FINRA Rule 4552 provides aggregate trade counts and volume but does not natively include initiating-side identification, meaning it does not show whether the aggressive order was a buyer or a seller. That limitation makes raw dark pool volume a necessary-but-not-sufficient signal for directional positioning. Elevated dark pool fraction, meaning volume share relative to the consolidated tape, does indicate heightened institutional interest in execution quality because institutions prefer ATS venues to minimize market impact on large orders. The directional ambiguity requires cross-validation: if the elevated dark pool fraction coincides with rising prices, expanding bid-ask spreads on lit venues consistent with inventory risk the specialist is taking, and increasing options put-call ratios consistent with hedging a large long, the weight of evidence tilts toward accumulation. If price is drifting down with elevated dark pool volume, the evidence tilts toward distribution. Third-party data providers such as Quod Financial, Liquidnet analytics, and FINRA ATS transparency data attempt to reconstruct directional flow by applying trade-sign algorithms such as Lee-Ready and bulk-volume classification to ATS prints, but these algorithms carry meaningful error rates in fragmented markets. The claim that elevated dark pool fraction definitively confirms a large institutional buyer is accumulating shares in advance of a public tender offer and that the fund should immediately build a large long position makes a directional inference the raw data cannot support and introduces potential MNPI risk framing through tender offer language with no basis in the described scenario. The claim that dark pool activity is always bearish because institutions use ATS venues specifically to liquidate positions without alerting retail investors is empirically false; dark pools are used for both accumulation and distribution, and the academic literature shows no systematic directional bias in ATS venue usage. The claim that elevated dark pool fraction indicates high-frequency trading firms are exploiting latency arbitrage and that the fund should avoid trading the stock entirely until the fraction normalizes conflates the dark pool fraction signal with HFT activity; dark pools are specifically structured to minimize HFT participation through various order types and latency mechanisms.