
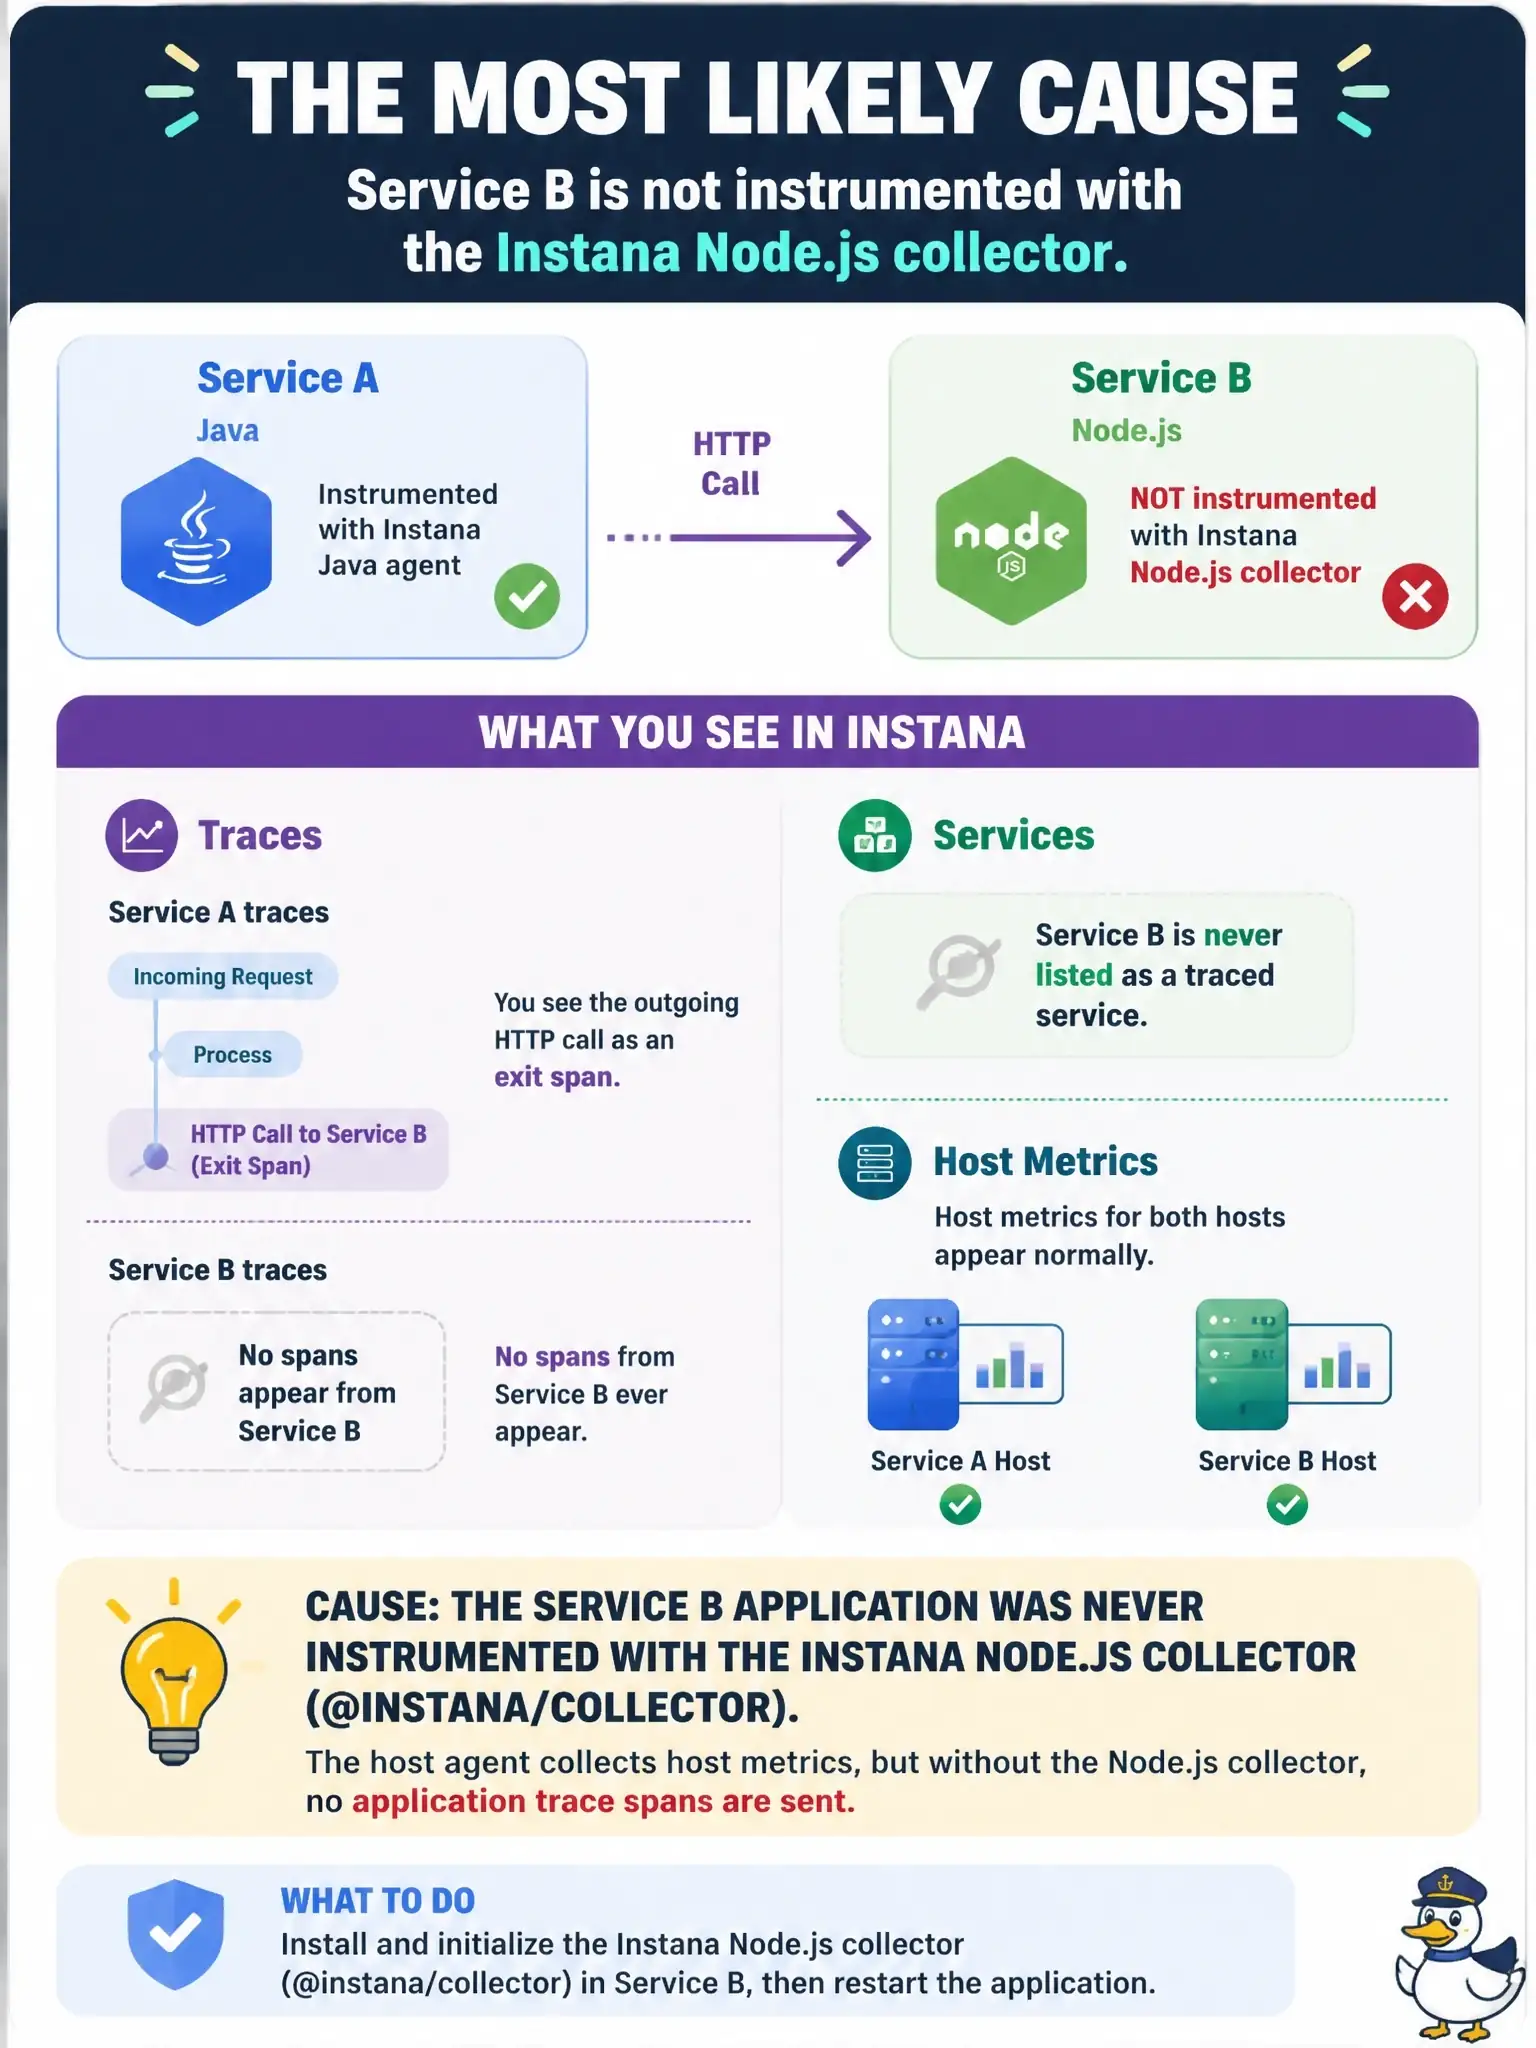
Service A (Java) calls Service B (Node.js) via HTTP. In Instana, Service A's traces show the outgoing HTTP call as an exit span, but no span from Service B ever appears and Service B is never listed as a traced service. Host metrics for both hosts appear normally. What is the most likely cause?
Select an answer to reveal the explanation.
Short Explanation
The host agent is like a building's security desk: it knows the building is fine, but it can't follow anyone into an office that has no camera. Node.js tracing needs the @instana/collector package inside the app itself. Without it, you'll see the Java exit call leave and nothing on the Node.js side ever show up.
Full Explanation
Instana traces Node.js applications through the Node.js collector, an npm package added to the application's dependencies that enables metrics collection and automatic tracing. The host agent must be installed first, but it acts as the local endpoint that receives data; it does not instrument a Node.js process on its own. That explains the symptoms exactly: host metrics arrive normally because the agent is running, and the Java service shows its outgoing HTTP exit span because its sensor works, yet no entry span ever appears for the Node.js service and it is never listed as a traced service. Putting the services in different zones is wrong because zones group hosts for display and do not stop a service from being traced. An outdated Java sensor that fails to send trace context headers is wrong because the downstream service would still report its own spans as a separate trace; here it reports none at all. A backend queue backlog is wrong because a processing delay would make spans arrive late, not never. For the exam, remember that runtime tracing in Node.js depends on the in-process collector, not on the host agent alone. As a check, confirm the collector is in the application's dependencies and is required as the very first line of the entry point, then restart the application.