
Where in the GitHub UI can you see a visual graph of your workflow's job execution and dependencies?
Select an answer to reveal the explanation.
Short Explanation and Infographic
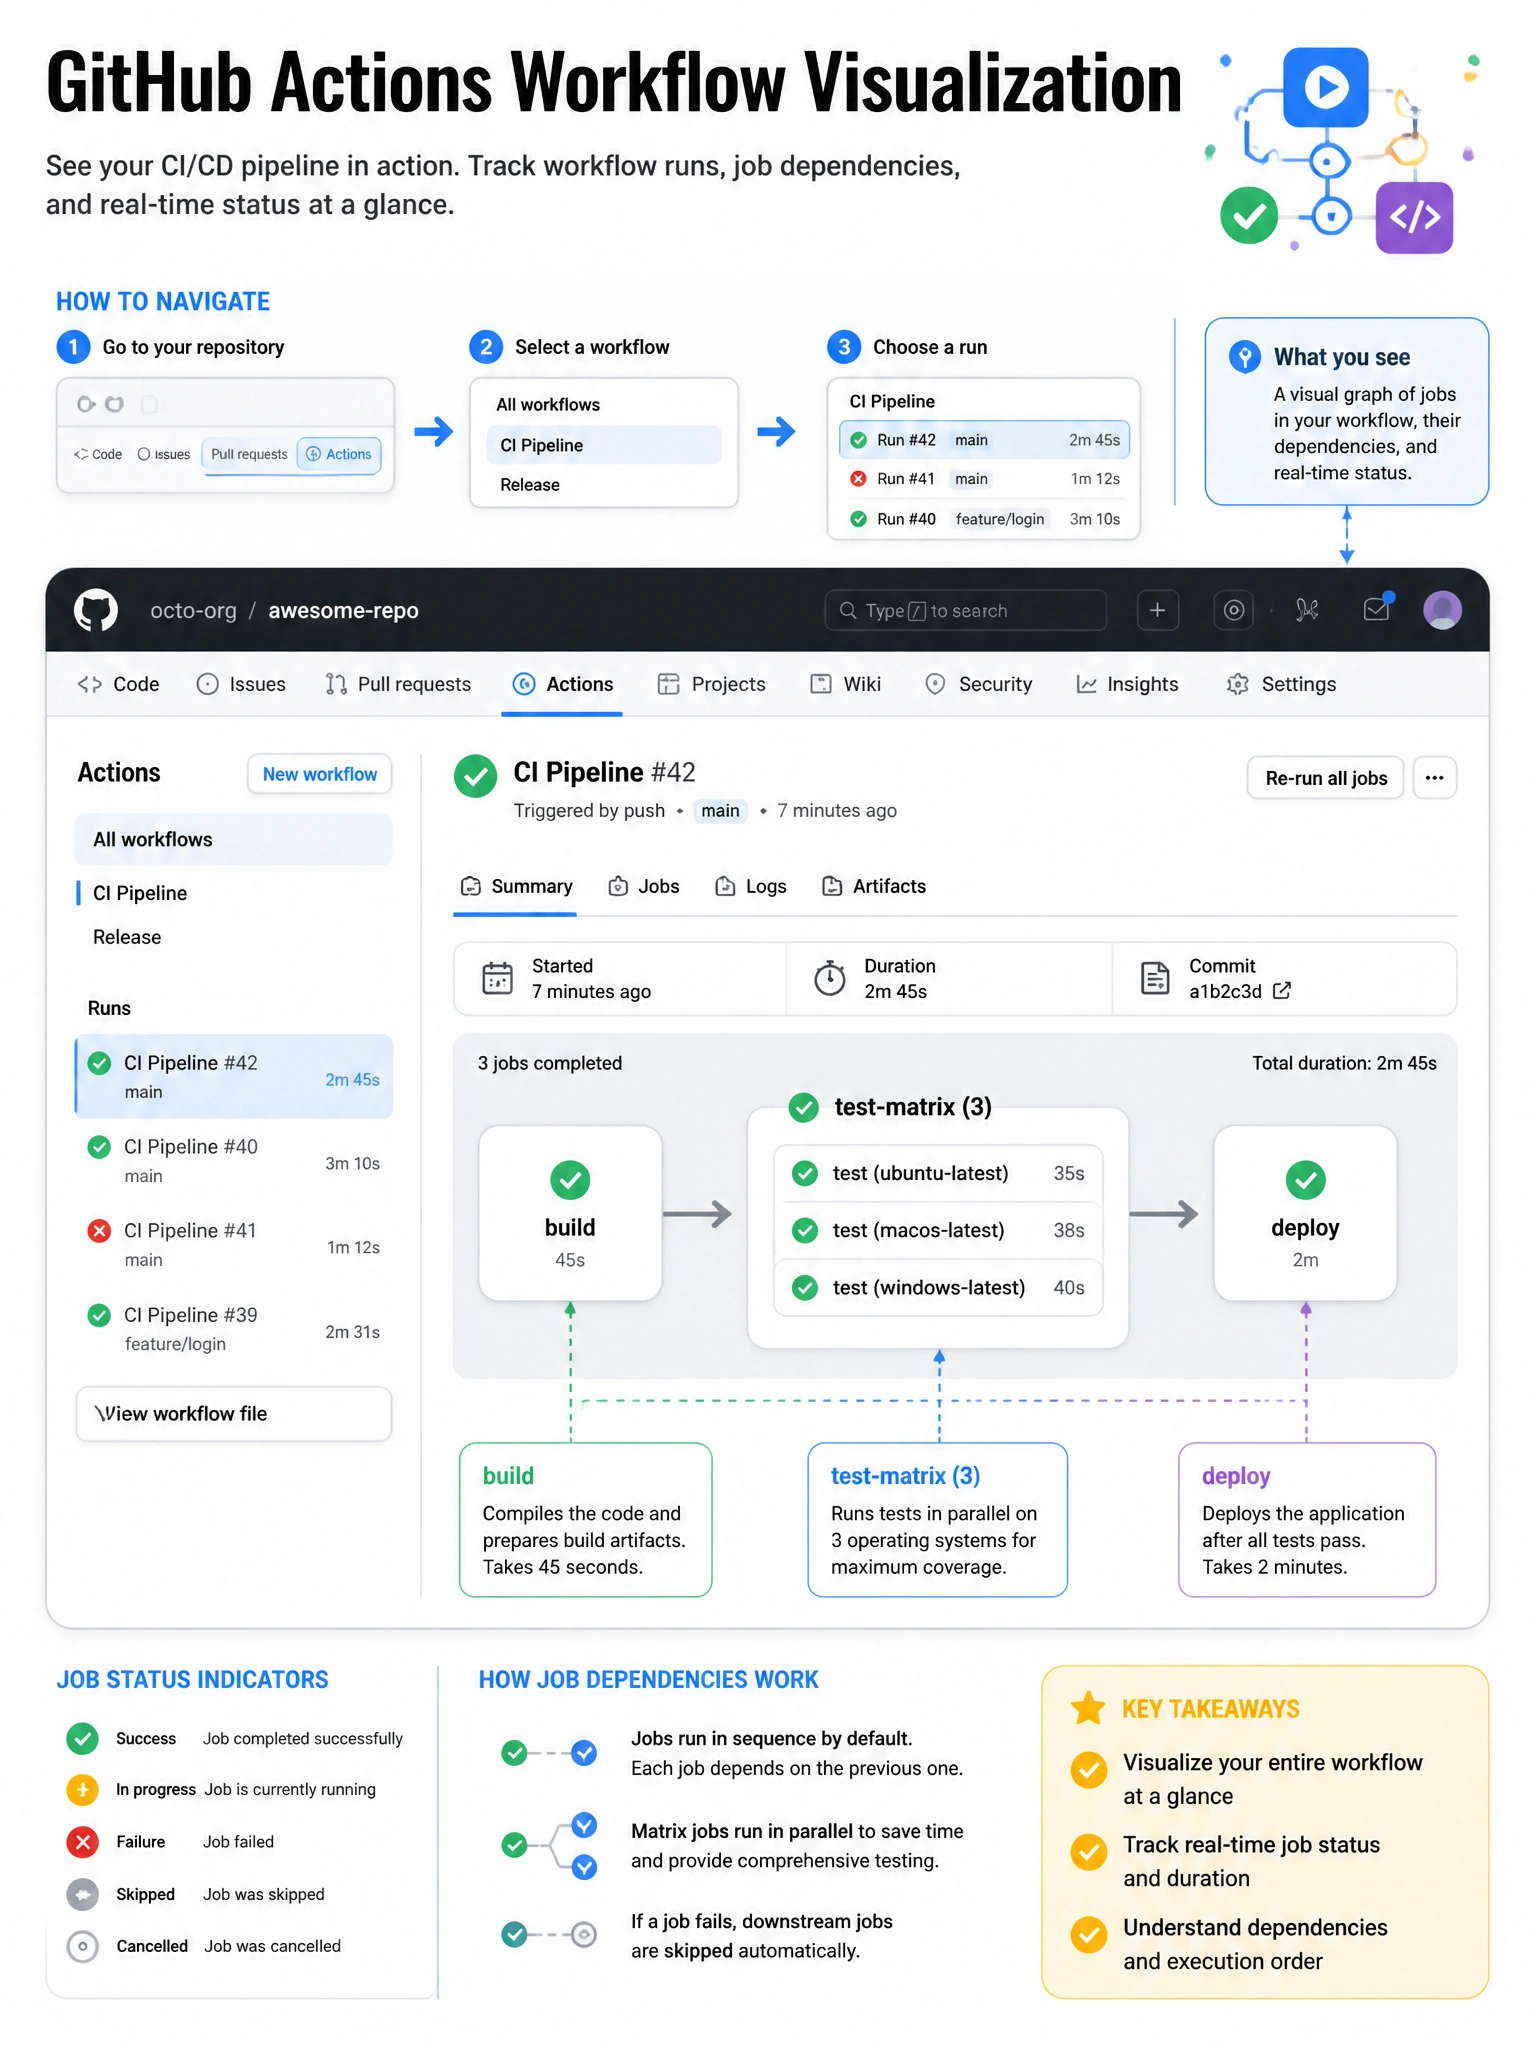
The workflow run page is the mission control panel — it shows a real-time visual graph of all jobs, their status, and execution order.
Full explanation below image
Full Explanation
The GitHub Actions workflow visualization is accessible from the repository's Actions tab → select a specific workflow → click on a run. The run page shows a visual job graph with job boxes, dependency arrows, execution status (queued/in progress/success/failed/skipped), and duration. This is particularly useful for matrix builds and complex multi-job workflows. 'Insights → Actions' shows aggregate usage metrics, not individual run graphs. Settings doesn't have a workflow graph view. 'gh workflow view' shows workflow metadata but not the visual run graph (use 'gh run view' for run details).