
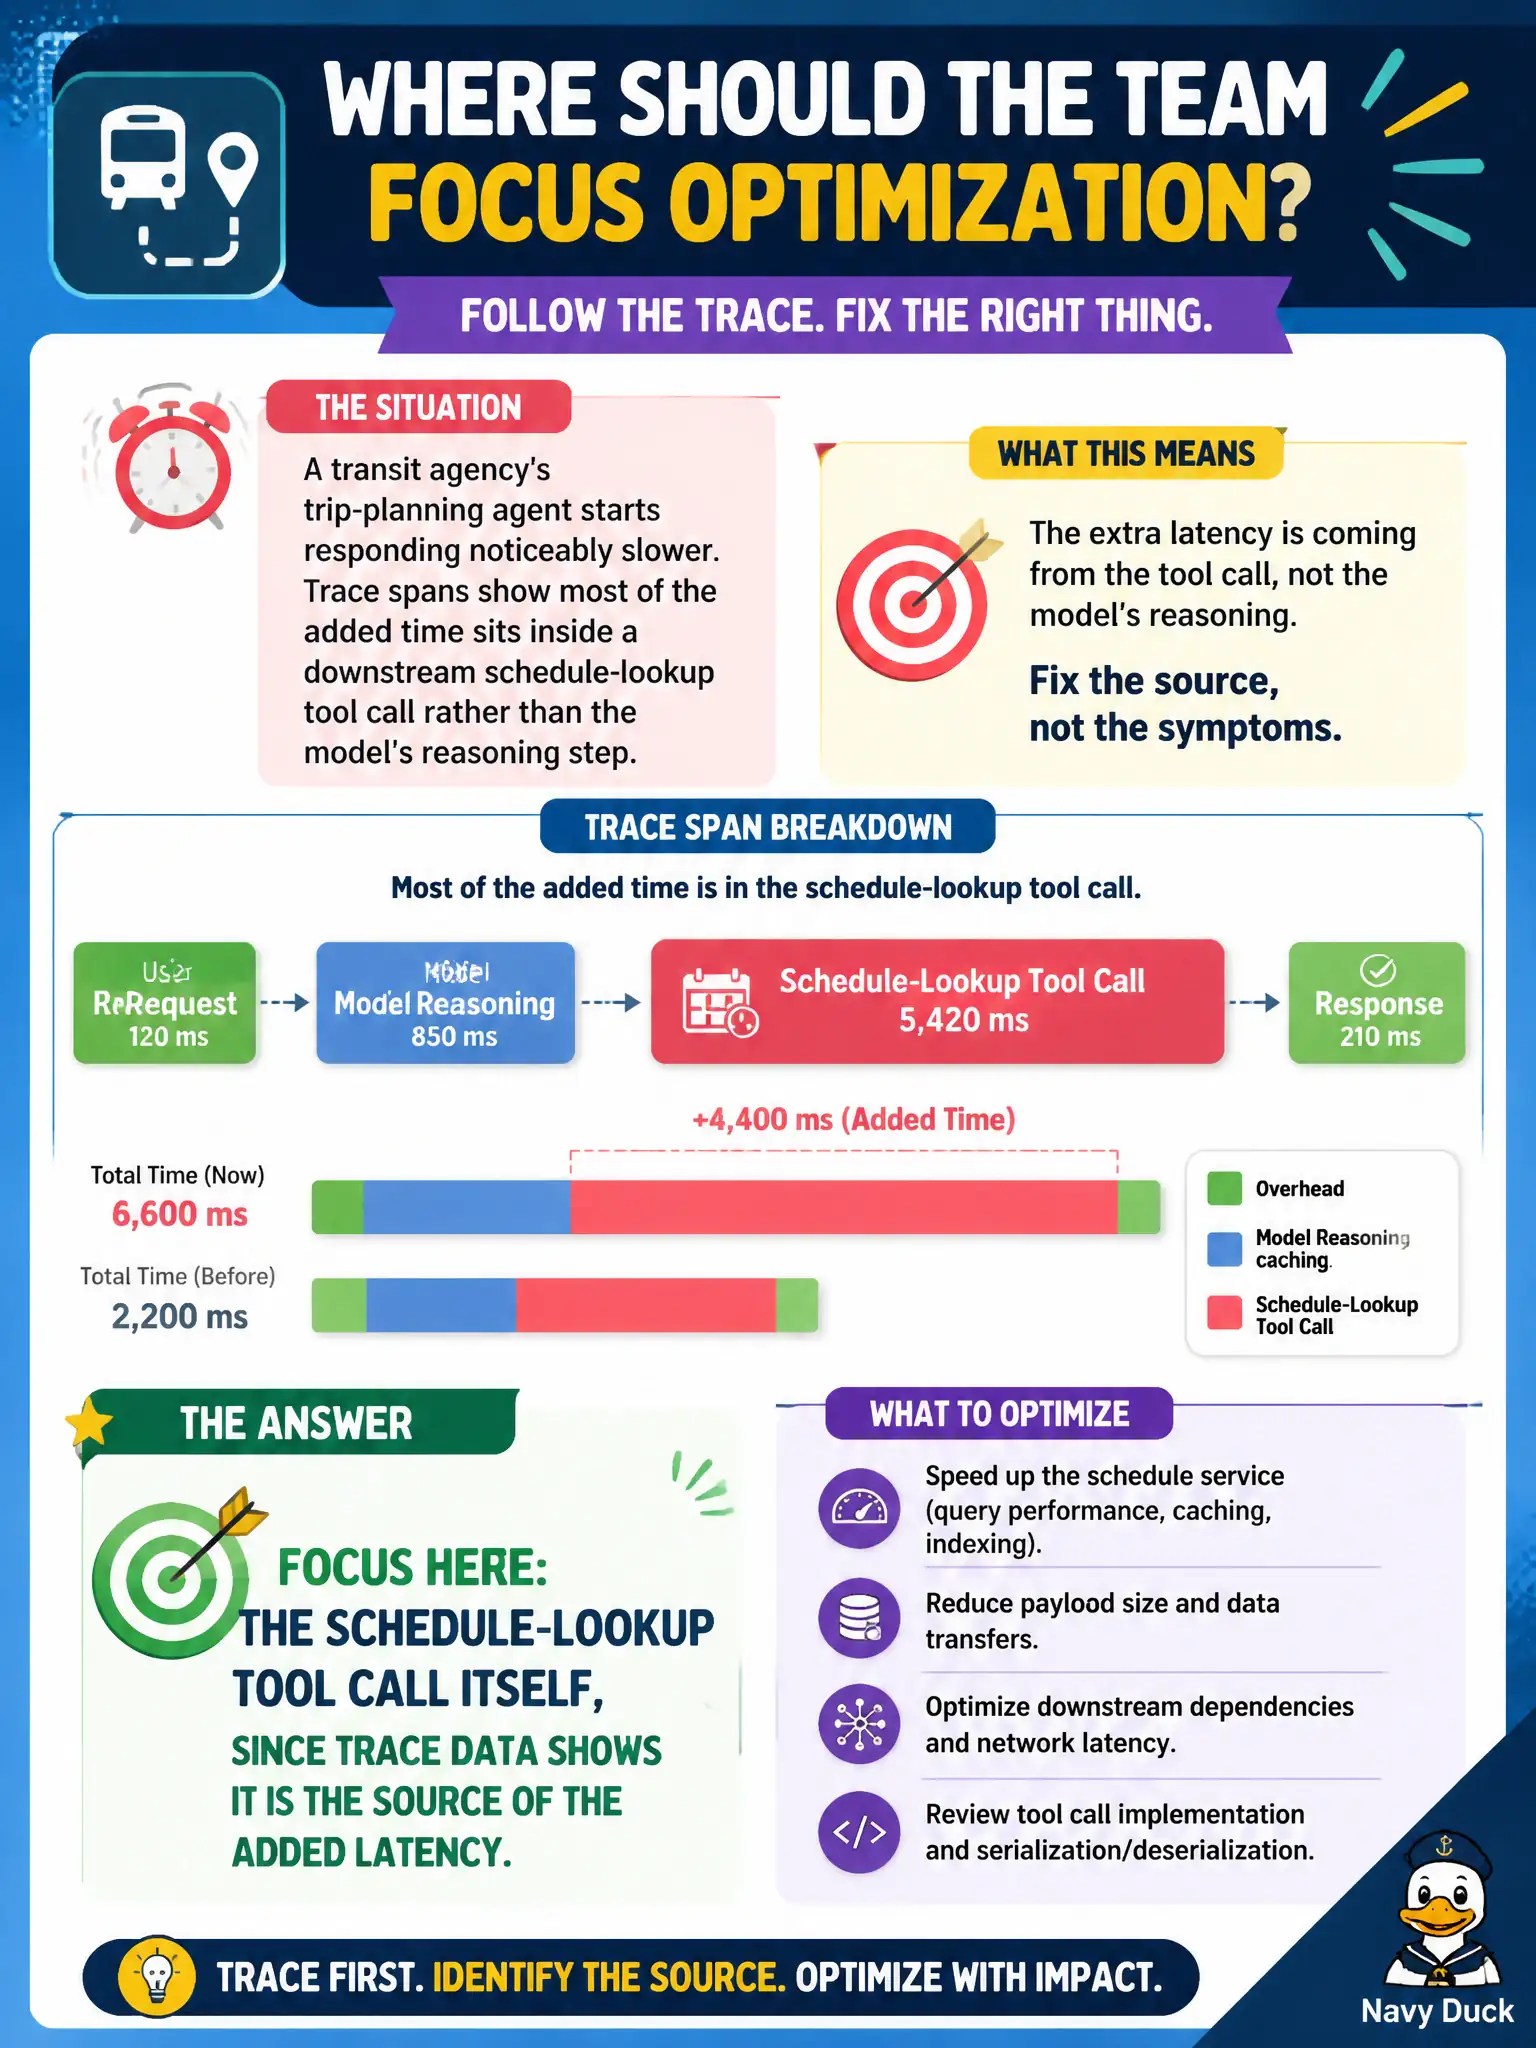
A transit agency's trip-planning agent starts responding noticeably slower, and trace spans show most of the added time sits inside a downstream schedule-lookup tool call rather than the model's reasoning step. Where should the team focus its optimization effort?
Select an answer to reveal the explanation.
Short Explanation
Picture a relay race where the runner's legs are fine but the baton handoff to a slow teammate eats all the time — that's what these trace spans reveal. The lookup tool, not the model's thinking, is the laggard, so that's where the tuning belongs. Trust the trace over a guess about where slowness usually comes from.
Full Explanation
Distributed tracing breaks a request into spans per stage — the reasoning step and each tool call — so when the largest span sits inside the schedule-lookup call, that call is the bottleneck worth profiling and optimizing (caching, indexing, a faster backend, batching) rather than guessing at the cause. Assuming prompt length as the default culprit skips right past the trace evidence pointing elsewhere, and a long context window would show up as added time in the reasoning span, not the tool span. Blaming multiagent overhead treats an architectural concern as if it were this specific symptom, without any trace support for it here. The evaluation pipeline runs separately from the live production request path, so its dataset freshness has no way to add latency to a resident's actual request. Scope caveat: latency contributors can compound, so isolating today's top span doesn't rule out a second contributor worth watching after the fix lands. Operational check: after optimizing the tool call, re-run the trace and confirm that span shrinks while the reasoning-step span stays flat.