
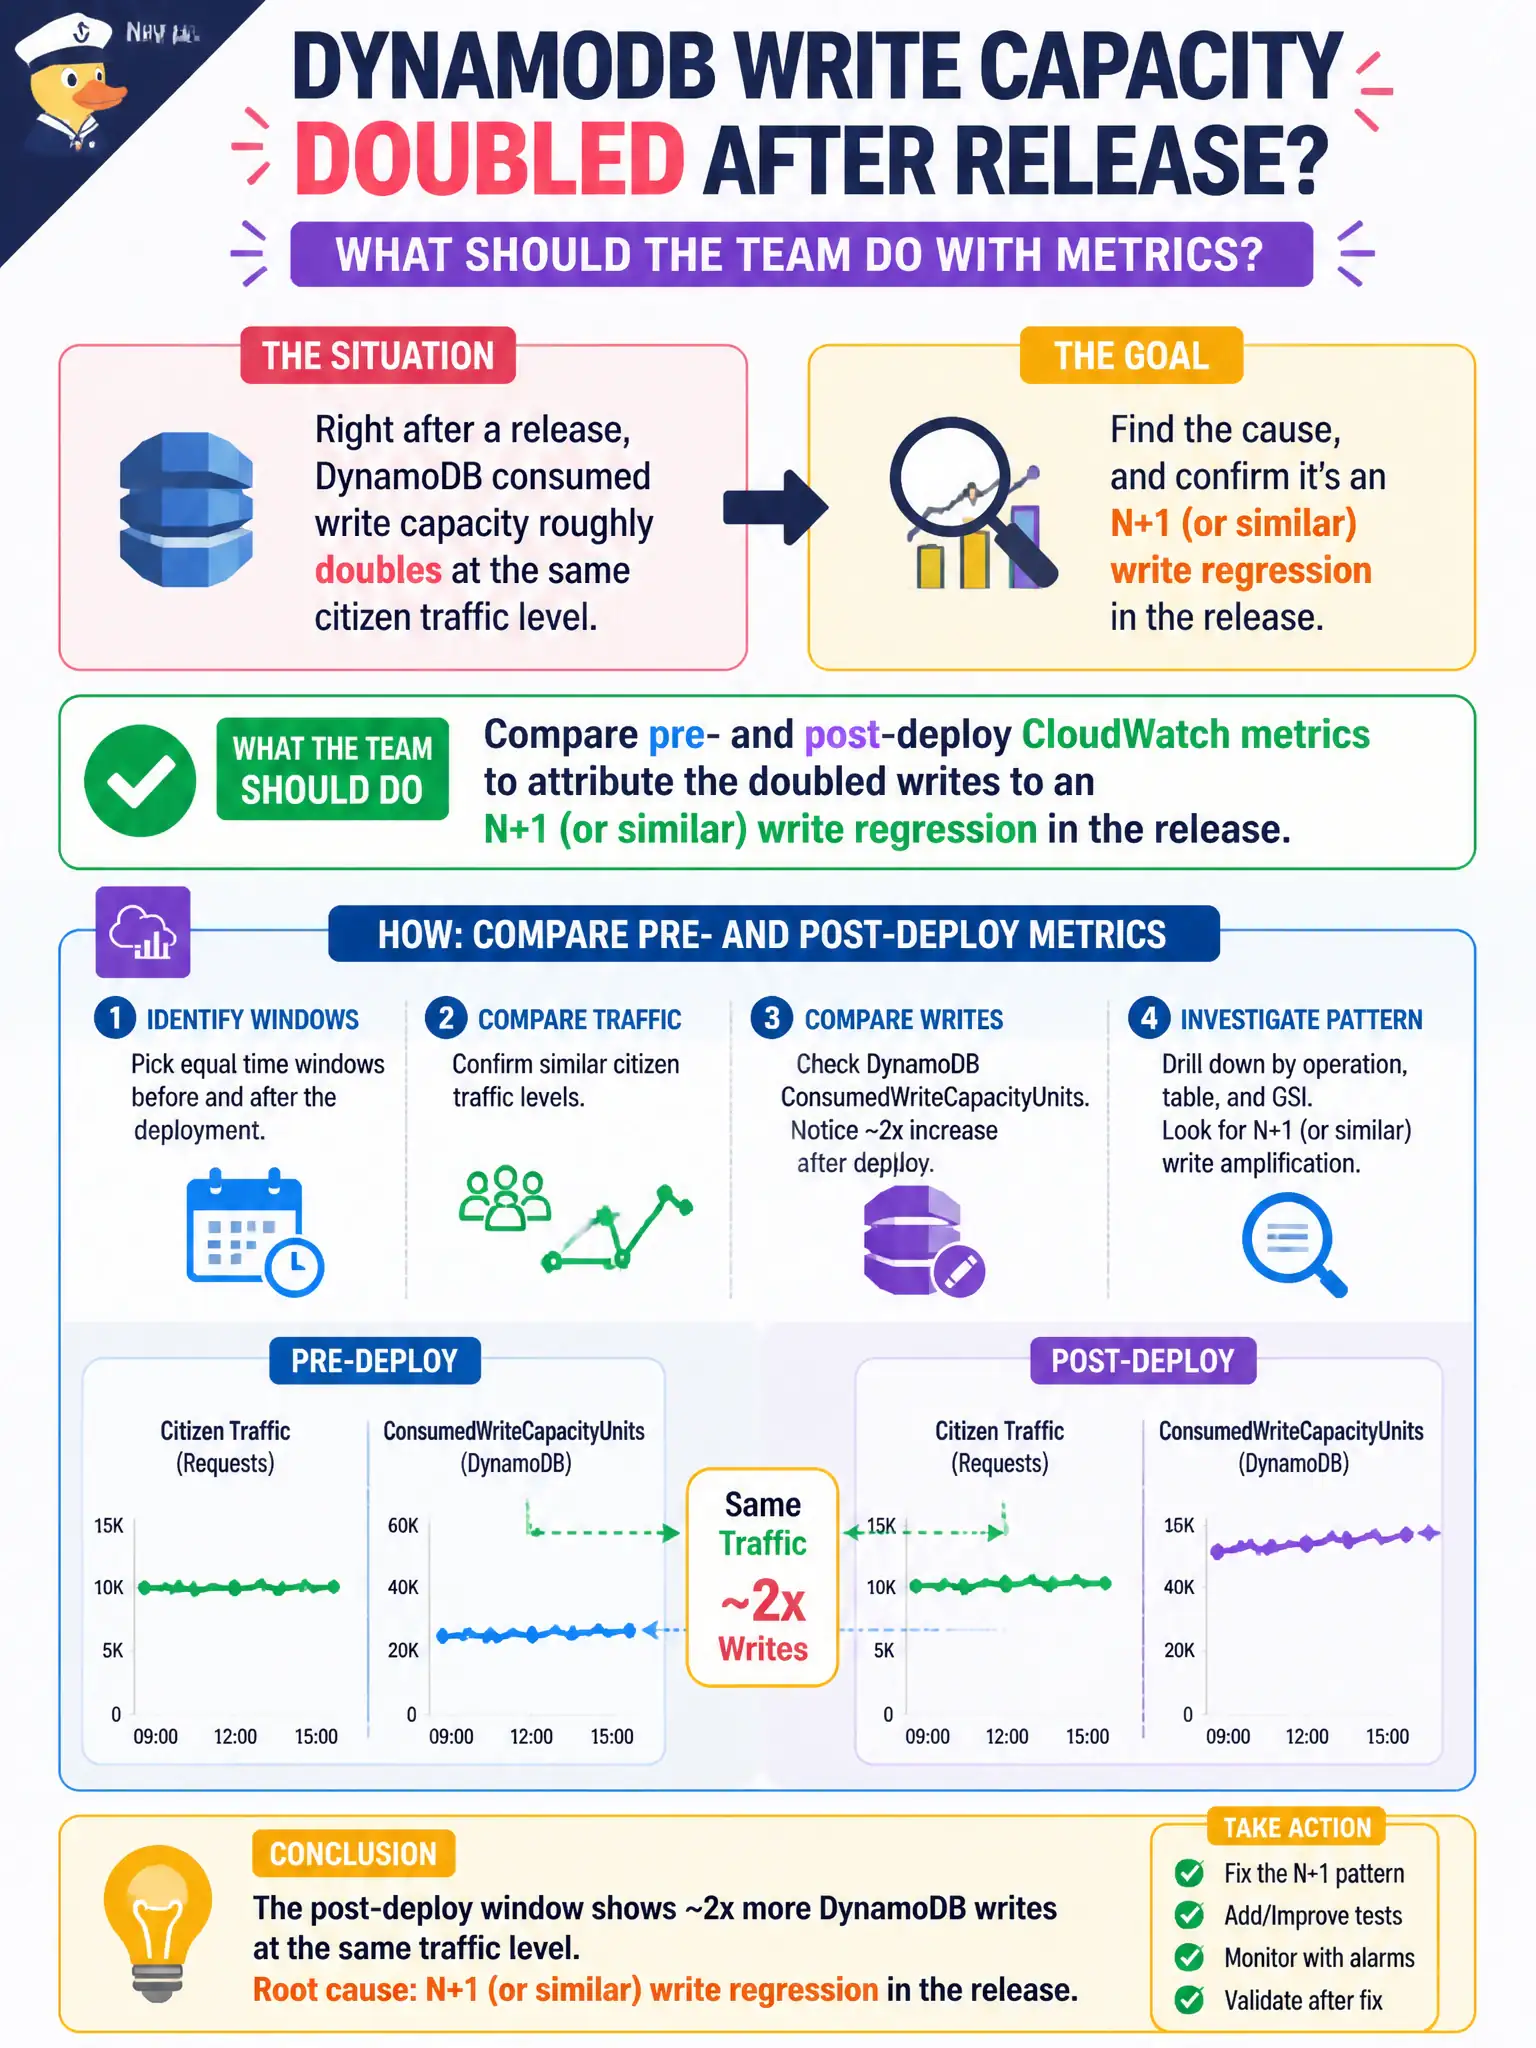
Right after a release, DynamoDB consumed write capacity roughly doubles at the same citizen traffic level. What should the team do with metrics?
Select an answer to reveal the explanation.
Short Explanation
Same citizen traffic, twice the write burn right after ship? Diff the CloudWatch write metrics across the deploy—odds are an N+1 write bug rode in with the release.
Full Explanation
Right after a release, when DynamoDB consumed write capacity roughly doubles at the same citizen traffic level, the team should compare pre- and post-deploy CloudWatch metrics to attribute the increase to an application regression—commonly an N+1 write pattern or duplicated PutItem/UpdateItem loops introduced in the release. Metrics timelines that align with the deploy marker are stronger evidence than release-note storytelling, and they prevent operators from blaming AWS for silently "doubling billed capacity" when the code simply writes twice as often per citizen action.
Ignoring capacity charts and only re-reading marketing release notes skips the quantitative signal that identifies the regression.
Assuming AWS silently doubled the table's billed capacity with no application change contradicts the equal traffic observation and metric timing.
Treating doubled writes as proof that X-Ray sampling must be set to zero confuses tracing cost controls with write-path defects.
Exam caveat: Use CloudWatch metrics around deploy markers to detect performance and cost regressions; correlate with code that performs extra writes per request.
Operational check: Overlay ConsumedWriteCapacityUnits with the deploy timestamp, reproduce a single citizen transaction in staging while counting write operations, fix the N+1 pattern, and verify write metrics return to baseline before wide municipal rollout. Keep the civic/municipal context in mind: permit and profile services can burn budget quickly when a "small" release doubles writes under daytime load.